Difference between revisions of "MCNP simulation of bremsstrahlung photons at the IAC"
Jump to navigation
Jump to search
| (23 intermediate revisions by the same user not shown) | |||
| Line 1: | Line 1: | ||
| − | Go back [[ | + | Go back [[MCNP simulations]] |
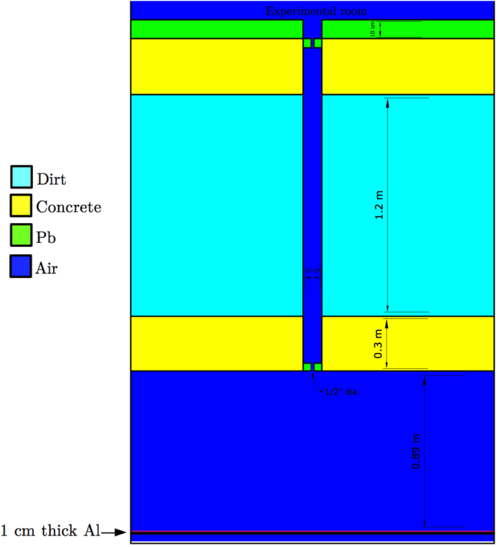
| − | + | MCNP6 was used to simulate a pencil point electron beam incident on a 1 cm thick Al bremsstrahlung radiator. A to-scale diagram of the geometry and materials used in the simulation is shown below. The geometry was designed to model closely after the IAC Main Hall area. | |
| + | <center> | ||
| − | [[File: | + | [[File:BremDistGeom3.png|500 px]] |
| − | + | </center> | |
| + | |||
| + | |||
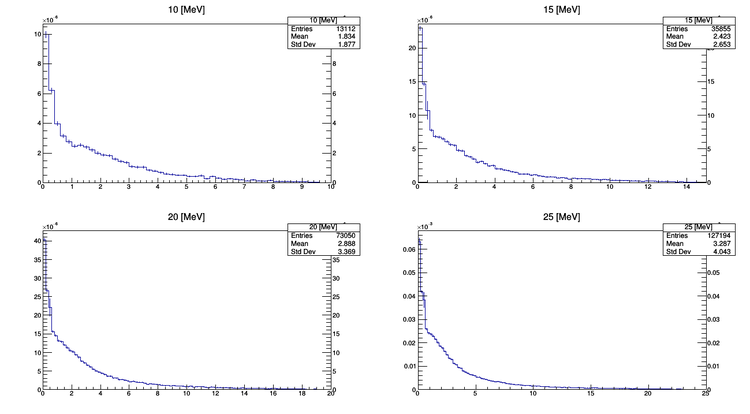
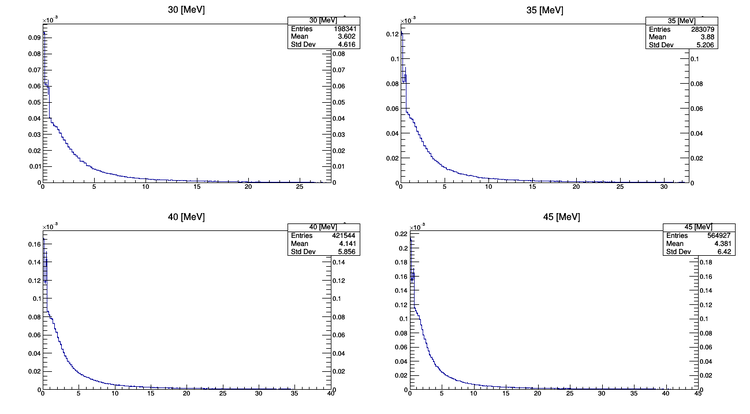
| + | Shown below are linear and log plots of the energy distribution of the bremsstrahlung photons that reach the experimental room. Plot titles are the energy of the incident electrons. 750,000 beam electrons were simulated for each incident electron energy. | ||
| Line 12: | Line 16: | ||
[[File:30-45MeV.png| 750 px]] | [[File:30-45MeV.png| 750 px]] | ||
| + | |||
| + | |||
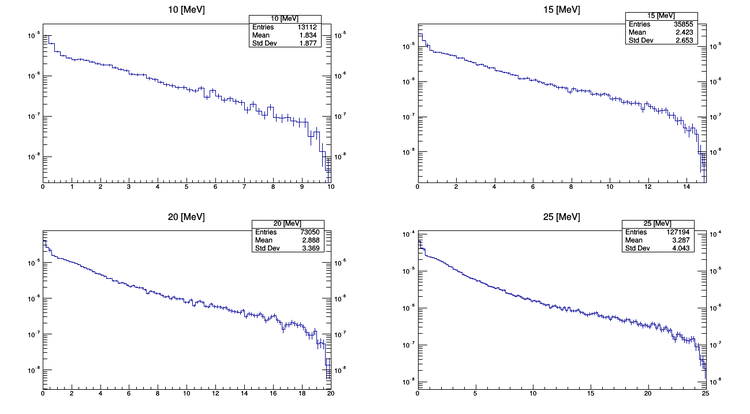
| + | Here are log-plots of the same data: | ||
| Line 23: | Line 30: | ||
| − | Go back [[ | + | Go back [[MCNP simulations]] |
Latest revision as of 10:00, 27 May 2016
Go back MCNP simulations
MCNP6 was used to simulate a pencil point electron beam incident on a 1 cm thick Al bremsstrahlung radiator. A to-scale diagram of the geometry and materials used in the simulation is shown below. The geometry was designed to model closely after the IAC Main Hall area.
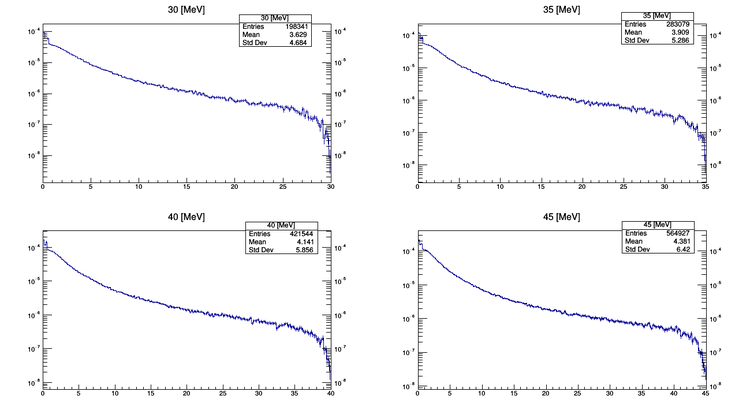
Shown below are linear and log plots of the energy distribution of the bremsstrahlung photons that reach the experimental room. Plot titles are the energy of the incident electrons. 750,000 beam electrons were simulated for each incident electron energy.
Here are log-plots of the same data:
Go back MCNP simulations
