Difference between revisions of "Position/Timing resolution study with CO-60"
Jump to navigation
Jump to search
(Created page with "Go back Vandagraph room A CO-60 source was placed 2" from the center of a detector, which was shielded from cosmics by 4" of lead, except for right below the source, where t…") |
(→Test 2) |
||
| (17 intermediate revisions by the same user not shown) | |||
| Line 1: | Line 1: | ||
| − | Go back [[ | + | Go back [[Van de Graaff room experiments]] |
| − | A CO-60 source was placed 2" from the center of a detector, which was shielded from cosmics by 4" of lead, except for right below the source, where there was small pin hole through the lead. | + | ==Test 1== |
| + | A CO-60 source was placed 2" from the center of a detector, which was shielded from cosmics by 4" of lead, except for right below the source, where there was small pin hole through the lead. Placed directly above the source is a finger detector that is in hardware coincidence with either PMT. | ||
| + | |||
| + | PMT threshold: 40 mV | ||
| + | |||
| + | Finger Threshold: 30 mV | ||
| + | |||
| + | PMT High voltage: 1700 V | ||
| + | |||
| + | Event rate: 2.8 Hz | ||
| + | |||
| + | |||
| + | [[File:Firstest.png|800px]] | ||
| + | |||
| + | |||
| + | ==Test 2== | ||
| + | PMT threshold: 40 mV | ||
| + | |||
| + | Finger Threshold: 30 mV | ||
| + | |||
| + | PMT High voltage: 1700 V | ||
| + | |||
| + | Event rate: 3.1 Hz | ||
| + | |||
| + | [[File:SecondTest.png|800px]] | ||
| + | |||
| + | Here is both sets of data superimposed and normalized to the count rate. | ||
| + | |||
| + | [[File:DualTimingGraph.png| 800px]] | ||
Latest revision as of 00:14, 20 May 2016
Go back Van de Graaff room experiments
Test 1
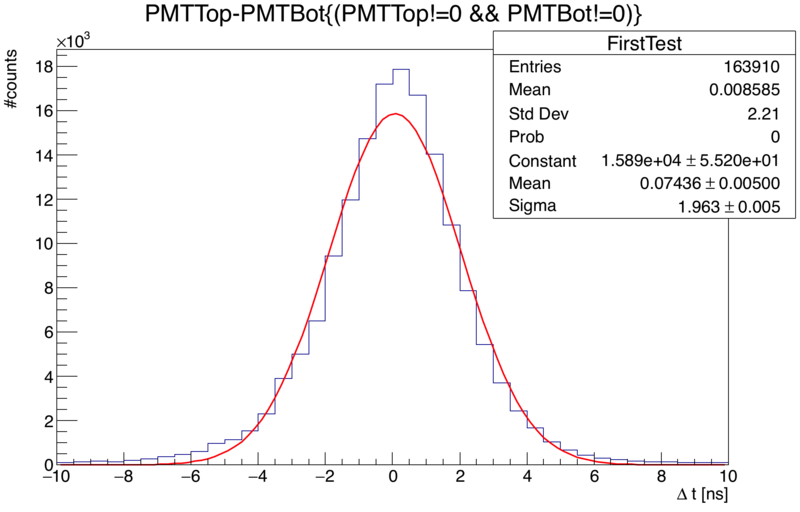
A CO-60 source was placed 2" from the center of a detector, which was shielded from cosmics by 4" of lead, except for right below the source, where there was small pin hole through the lead. Placed directly above the source is a finger detector that is in hardware coincidence with either PMT.
PMT threshold: 40 mV
Finger Threshold: 30 mV
PMT High voltage: 1700 V
Event rate: 2.8 Hz
Test 2
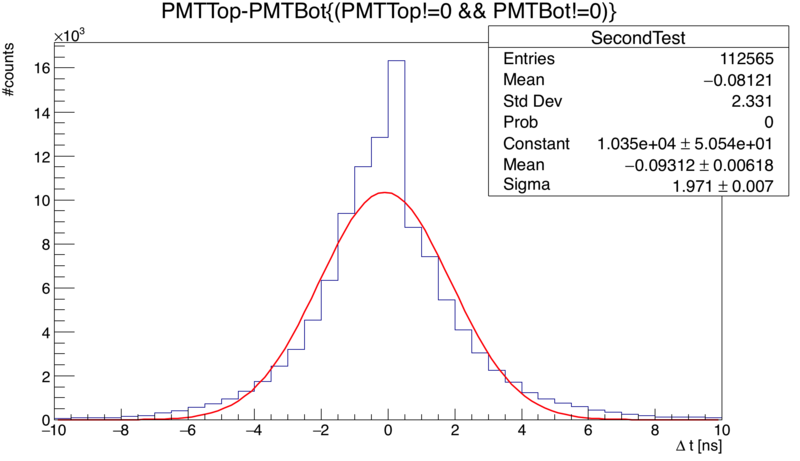
PMT threshold: 40 mV
Finger Threshold: 30 mV
PMT High voltage: 1700 V
Event rate: 3.1 Hz
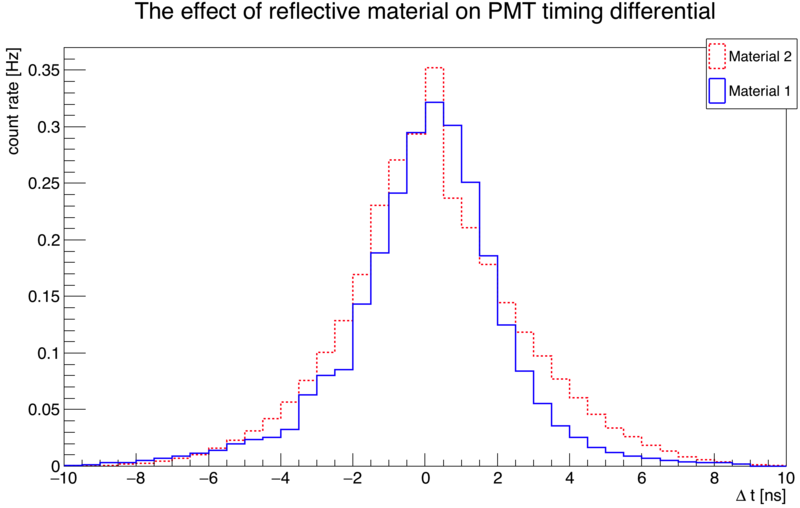
Here is both sets of data superimposed and normalized to the count rate.


