Difference between revisions of "A W thesis old"
| Line 79: | Line 79: | ||
=1836 keV signal table= | =1836 keV signal table= | ||
| + | ===1836.1 keV Signal Table=== | ||
| + | {| border="1" |cellpadding="20" cellspacing="0 | ||
| + | |- | ||
| + | | <math>T_{1/2}</math> || Trig || Signal || BackG Subtracted || colspan="5" | Fit Parameters || Signal Area || Noise Area || SNR | ||
| + | |- | ||
| + | | 0.44 ||coin || [[File:Run6980_1836_raw.png | 100 px]] || [[File:Run6980_1836_sub.png | 100 px]] || <math>\mu=</math> 1833.43 +/- 0.0058 || <math>\sigma=</math> 1.447 +/- 0.0228 || A= 0.0036 +/- 5.937e-7 || B= 1.129e-6 +/- 9.991e-10 || C=-2.041e-3 +/- 1.682e-6 || 0.0127 +/- 3.752e-4 || 1.937e-4 +/- 2.421e-5 || 65.781 +/- 0.0096 | ||
| + | |- | ||
| + | | rowspan="2" | 0.98 || sing || [[File:Run7022_1836_raw1.png | 100 px]] || [[File:Run7022_1836_sub.png | 100 px]] || <math>\mu=</math> 1837.7 +/- 0.02 || <math>\sigma=</math> 1.126 +/- 0.0264 || A=0.3115 +/- 9.318e-6 || B=3.759e-5 +/- 2.793e-7|| C=-6.575e-2 +/- 5.102e-4 || 0.8590 +/- 0.0253 || 0.0200 +/- 0.0025 ||42.920 +/- 0.6349 | ||
| + | |- | ||
| + | | coin || [[File:Run7023_1836_raw.png | 100 px]] || [[File:Run7023_1836_sub.png | 100 px]] || <math>\mu=</math> 1835.86 +/- 0.01 || <math>\sigma=</math> 1.406 +/- 0.0201|| A= 0.0018 +/- 2.541e-7 || B= 4.930e-9 +/- 5.263e-11|| C= 8.945e-6 +/- 8.814e-8|| 0.0063 +/- 1.853e-4 ||1.037e-4 +/- 1.297e-5|| 60.662 +/- 0.0047 | ||
| + | |- | ||
| + | | rowspan="2" | 1.46 || sing || [[File:Run7107_1836_raw.png | 100 px]] || [[File:Run7107_1836_sub.png | 100 px]] || <math>\mu=</math>1838.65 +/- 0.0436 || <math>\sigma=</math> 1.117 +/- 0.0569 || A=0.1757 +/- 3.782e-5 || B=2.046e-4 +/- 1.5e-9|| C=-3.713e-1 +/- 4.940e-5 || 0.4933 +/- 0.0145|| 0.0234 +/- 0.0029 ||21.115 +/- 0.3456 | ||
| + | |- | ||
| + | | coin || [[File:Run7108_1836_raw.png | 100 px]] || [[File:Run7108_1836_sub.png | 100 px]] || <math>\mu=</math> 1838.003 +/- 0.0115 || <math>\sigma=</math> 1.854 +/- 0.0242|| A= 9.717e-4 +/- 4.374e-7 || B= 7.051e-7 +/- 1.119e-10|| C=-1.291e-3 +/- 1.738e-7 || 0.0044+/- 1.286e-4 || 4.248e-5 +/- 5.309e-6 || 102.838 +/- 0.0033 | ||
| + | |- | ||
| + | | rowspan="2" | 2.12 || sing || [[File:Run7203_1836_raw.png | 100 px]] || [[File:Run7203_1836_sub.png | 100 px]] || <math>\mu=</math> 1831.333 +/- 0.2887 || <math>\sigma=</math> 0.5219 +/- 0.0555 || A= 0.1601+/- 1.321e-4 || B=-1.429e-6 +/- 1.565e-10|| C=2.260e-2 +/- 5.944e-7 ||0.2214 +/- 0.0065 || 0.0462 +/- 0.0058 || 4.796 +/- 0.1192 | ||
| + | |- | ||
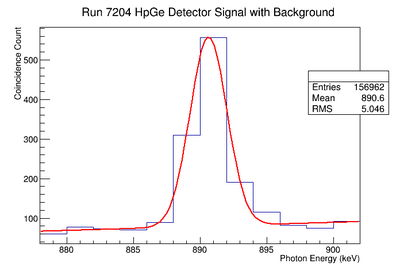
| + | | coin || [[File:Run7204_1836_raw.png | 100 px]] || [[File:Run7204_1836_sub.png | 100 px]] || <math>\mu=</math> 1824.26 +/- 0.0153 || <math>\sigma=</math> 1.570 +/- 0.0871 || A= 5.842e-4 +/- 1.552e-5 || B= -7.557e-7 +/- 6.718e-11 || C= 1.405e-3 +/- 1.754e-7 || 0.0024 +/- 7.002e-5 || 1.802e-4 +/- 2.252e-5 || 13.198 +/- 0.0016 | ||
| + | |- | ||
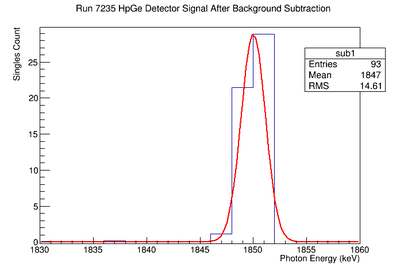
| + | | rowspan="2" | 2.27 || sing || [[File:Run7235_1836_raw.png | 100 px]] || [[File:Run7235_1836_sub.png | 100 px]] || <math>\mu=</math> 1850.08 +/- 0.0361|| <math>\sigma=</math> 1.238 +/- 0.1486|| A=0.0741 +/- 3.058e-4 || B=4.389e-4 +/- 5.774e-10|| C=-8.040e-1 +/- 1.270e-4 || 0.2471+/- 0.0073 ||0.0451 +/- 0.0056 || 5.478 +/- 0.1354 | ||
| + | |- | ||
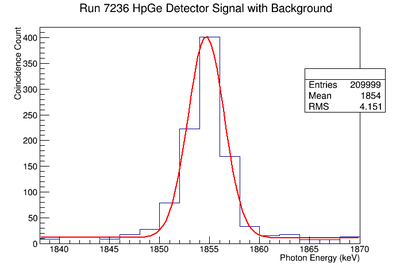
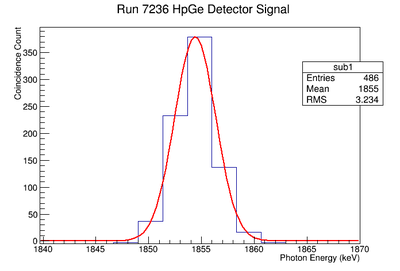
| + | | coin || [[File:Run7236_1836_raw.png | 100 px]] || [[File:Run7236_1836_sub.png | 100 px]] || <math>\mu=</math> 1854.58 +/- 0.1587 || <math>\sigma=</math> 1.696+/- 0.1625 || A= 3.873e-4 +/- 8.569e-7 || B= -9.482e-7 +/- 7.143e-11 || C= 0.0018 +/-3.216e-7 || 0.0017 +/- 5.083e-5 || 1.623e-5 +/- 2.028e-6 || 106.360 +/- 0.0012 | ||
| + | |- | ||
| + | |} | ||
| + | |||
| + | |||
| + | |||
| + | '''Re-Fit of Run 7203 without Event Cuts ''' | ||
| + | {| border="1" |cellpadding="20" cellspacing="0 | ||
| + | |- | ||
| + | | <math>T_{1/2}</math> || Trig || Signal || BackG Subtracted || colspan="5" | Fit Parameters || Signal Area || Noise Area || SNR | ||
| + | |- | ||
| + | | 2.12 ||sing || [[File:Run7203_1836_raw_nocut.png | 100 px]] || [[File:Run7203_1836_sub_nocut.png | 100 px]] || <math>\mu=</math>1831.55 +/- 1.74 || <math>\sigma=</math>0.6455 +/- 0.0693 || A= 0.0658 +/- 0.0007 || B= 7.775e-6+/- 1.615e-7 || C= -7.311e-3 +/- 2.991e-4 || 0.1139 +/- 0.0034 || 0.0216 +/- 0.0027|| 5.282 +/- 0.0598 | ||
| + | |- | ||
| + | |} | ||
| + | |||
| + | |||
| + | |||
| + | |||
| + | '''Re-Fit of Run 7236 without Event Cuts ''' | ||
| + | {| border="1" |cellpadding="20" cellspacing="0 | ||
| + | |- | ||
| + | | <math>T_{1/2}</math> || Trig || Signal || BackG Subtracted || colspan="5" | Fit Parameters || Signal Area || Noise Area || SNR | ||
| + | |- | ||
| + | | 2.12 ||sing || [[File:Run7236_1836_raw_nocut.png | 100 px]] || [[File:Run7236_1836_sub_nocut.png | 100 px]] || <math>\mu=</math> 1860.48 +/- 0.0874 || <math>\sigma=</math>7.160 +/- 0.5751 || A= 7.067e-5 +/- 1.151e-6 || B= 8.389e-9+/- 1.764e-8 || C= -1.293e-5 +/- 3.280e-5 || 0.0013 +/- 3.914e-5 || 0.0021 +/- 0.0003 || 0.6289 +/- 0.0007 | ||
| + | |- | ||
| + | |} | ||
| + | |||
| + | |||
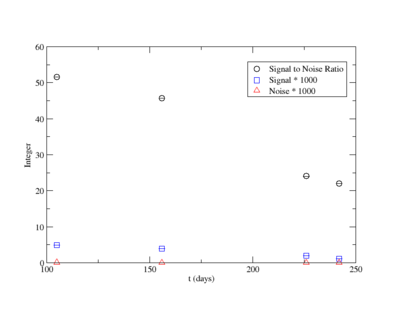
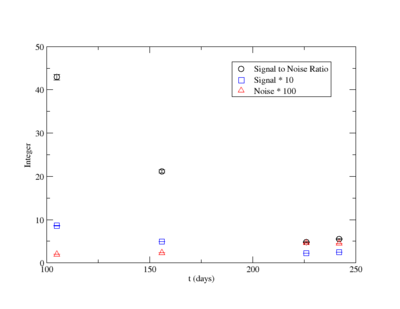
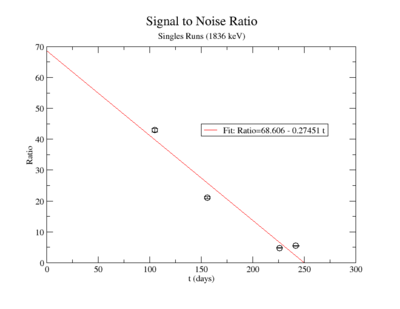
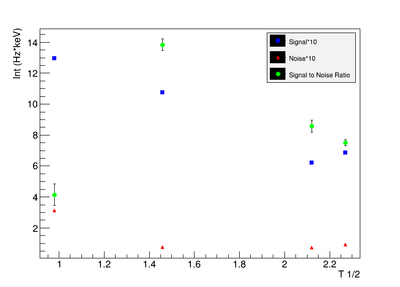
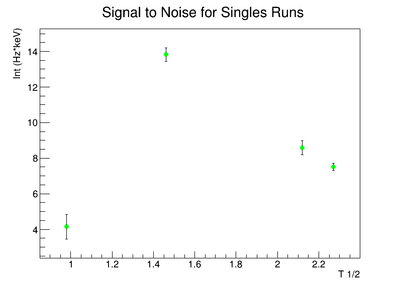
| + | Signal, Noise, and Signal to Noise Ratio plots for 1836 keV singles runs. | ||
| + | |||
| + | [[File:S_N_SNR_1836_singles.png | 400 px]] | ||
| + | [[File:SNR_1836_singles.png | 400 px]] | ||
| + | |||
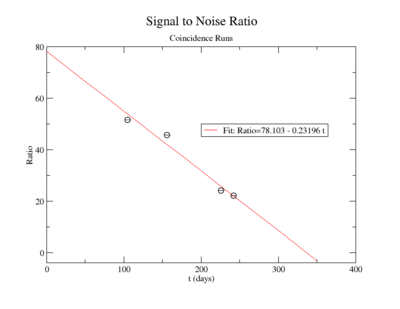
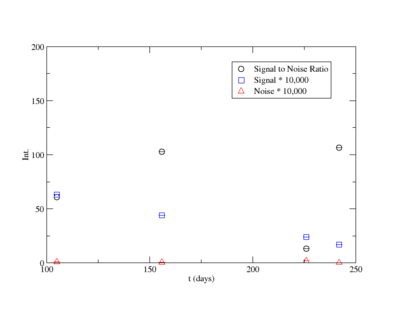
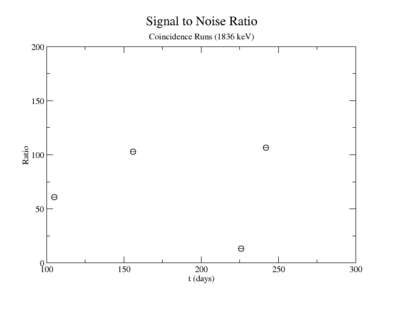
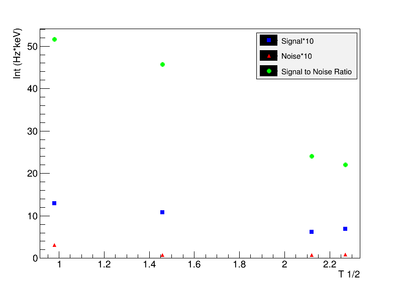
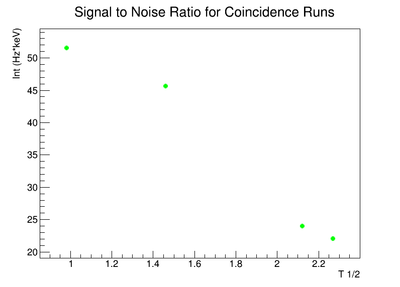
| + | Signal, Noise, and Signal to Noise Ratio plots for 1836 keV coincidence runs. | ||
| + | |||
| + | [[File:S_N_SNR_1836_coin.png | 400 px]] | ||
| + | [[File:SNR_1836_coin.png | 400 px]] | ||
| + | |||
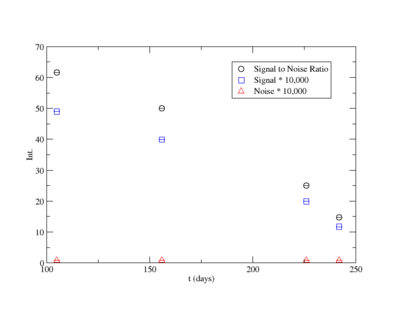
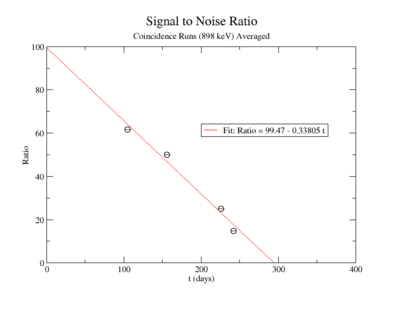
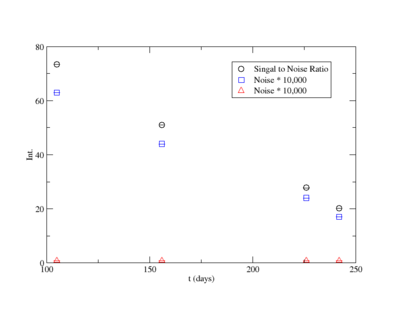
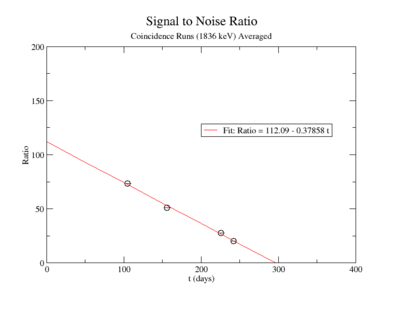
| + | Averaging over the noise values: | ||
| + | |||
| + | [[File:S_N_SNR_1836_coin_avg.png | 400 px]] | ||
| + | [[File:SNR_1836_coin_avg.png | 400 px]] | ||
| + | |||
| + | Signal to Noise Ratio (Singles and Coincidence): | ||
| + | [[File:SNR_1836_both.png | 400 px]] | ||
==other= | ==other= | ||
Revision as of 18:44, 2 September 2014
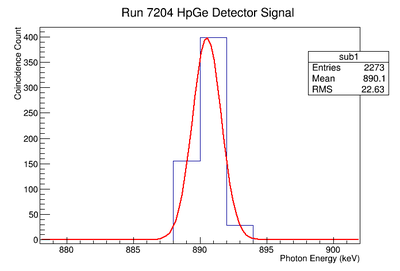
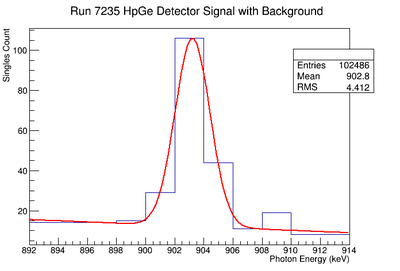
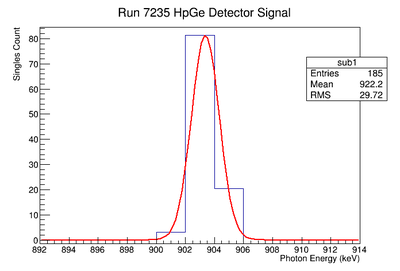
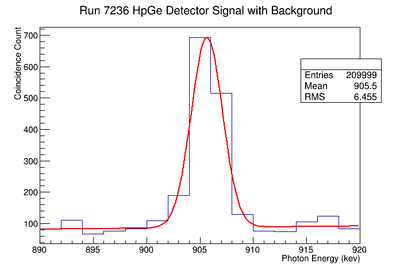
898 keV signal table
Re-Fit of Run 7203 without Event Cuts
Re-Fit of Run 7203 without Event Cuts and Scaled by 1.66
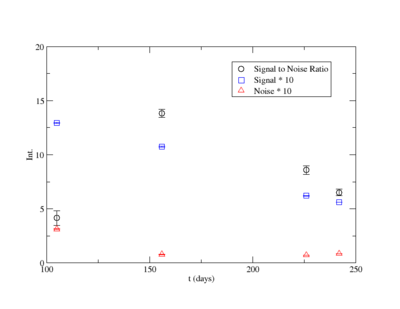
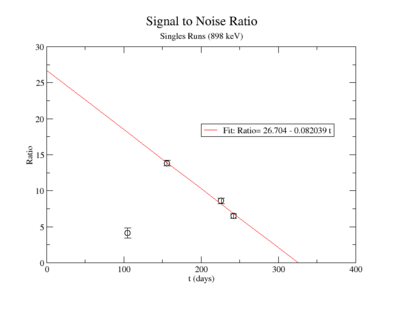
Signal, Noise, and Signal to Noise Ratio plots for 898 keV singles runs.
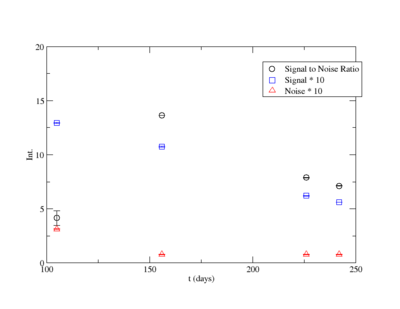
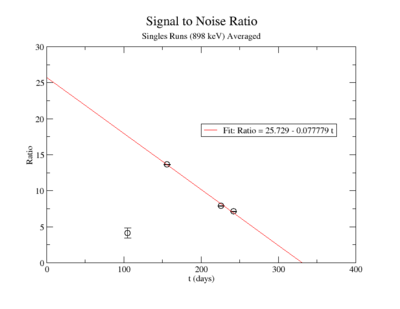
Averaging over the last three noise values:
Signal, Noise, and Signal to Noise Ratio plots for 898 keV coincidence runs.
Averaging over the noise values:
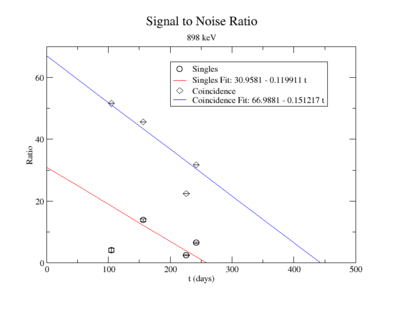
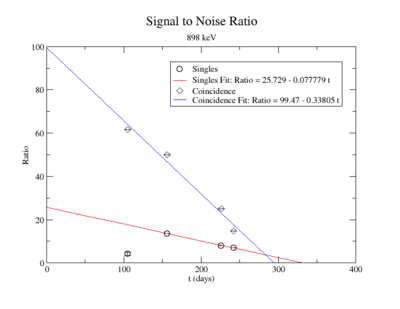
Signal to Noise Ratio (Singles and Coincidence):
1836 keV signal table
1836.1 keV Signal Table
Re-Fit of Run 7203 without Event Cuts
Re-Fit of Run 7236 without Event Cuts
Signal, Noise, and Signal to Noise Ratio plots for 1836 keV singles runs.
Signal, Noise, and Signal to Noise Ratio plots for 1836 keV coincidence runs.
Averaging over the noise values:
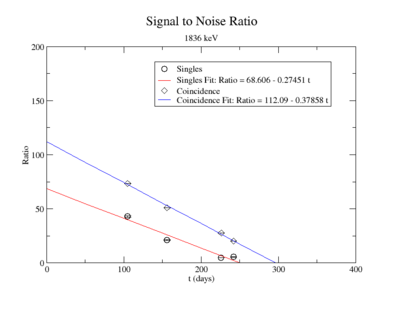
Signal to Noise Ratio (Singles and Coincidence):
=other
898 keV Signal and Background Noise Table
| Run # | Area of Signal | Area of Background | Signal to Noise Ratio |
| 7203 | 130.17 | 120.59 | 1.08 |
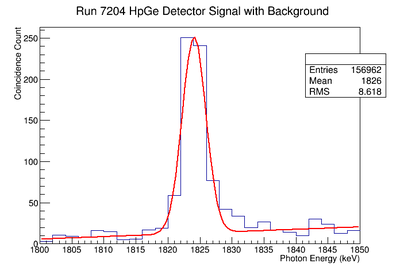
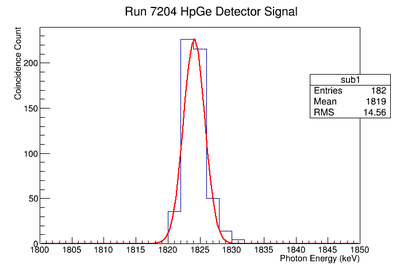
| 7204 | 825.34 | 558.66 | 1.48 |
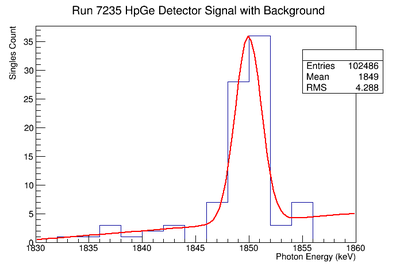
| 7235 | 194.38 | 60.23 | 3.23 |
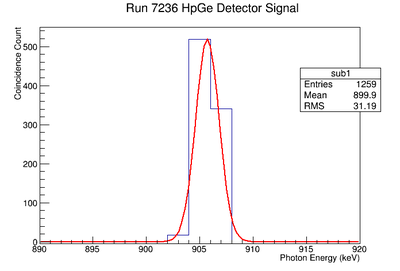
| 7236 | 1429.75 | 436.93 | 3.27 |
1836.1 keV Signal and Background Noise Table
| Run # | Area of Signal | Area of Background | Signal to Noise Ratio |
| 7203 | 83.29 | 24.73 | 3.37 |
| 7204 | 944.58 | 101.68 | 9.29 |
| 7235 | 82.25 | 20.90 | 3.94 |
| 7236 | 1849.86 | 97.64 | 18.95 |
Efficiency on 2/28/2014
| Run | Source | Energy | Expected rate (Hz) | HpGe Det B Rate (ADC 7) (Hz) | HpGe Eff (%) |
| 7028 | Ba-133 | 80.9971 | 1067.468 +/- 1.131 | 14.483 +/- 1.442 | 1.357 |
| 7028 | Ba-133 | 276.3997 | 221.297 +/- 0.2345 | 4.239 +/- 0.9671 | 1.916 |
| 7028 | Ba-133 | 302.8510 | 574.310 +/- 0.6085 | 9.523 +/- 0.5539 | 1.658 |
| 7028 | Ba-133 | 356.0134 | 1941.418 +/- 2.057 | 27.130 +/- 1.316 | 1.397 |
| 7028 | Ba-133 | 383.8480 | 278.416 +/- 0.2950 | 3.982 +/- 0.2440 | 1.430 |
| 7027 | Na-22 | 511 | 1589.218 +/- 1.842 | 17.545 +/- 0.4560 | 1.104 |
| 7025 | Cs-137 | 661.657 | 2548.022 +/- 2.222 | 25.622+/- 0.3286 | 1.006 |
| 7029 | Mn-54 | 834.848 | 4032.782 +/- 0.0114 | 0.2911 +/- 0.1667 | 0.0072 |
| 7026 | Co-60 | 1173.228 | 1876.619 +/- 0.2687 | 11.062 +/- 0.1215 | 0.589 |
| 7027 | Na-22 | 1274.537 | 888.264 +/- 1.029 | 4.685 +/- 0.0825 | 0.527 |
| 7026 | Co-60 | 1332.492 | 1878.167 +/- 0.2690 | 9.616 +/- 0.1181 | 0.512 |
Signal, Noise, and Signal to Noise Ratio plots for 898 keV singles runs.
Signal, Noise, and Signal to Noise Ratio plots for 898 keV coincidence runs.
| Trig | Fit Parameters | Signal Area | Noise Area | SNR | |||||
| 0.98 | sing | 897.260 +/- 0.0047 | 0.7074 +/- 0.0280 | A=0.725 +/- 0.0129 | B= 8.448e-4+/- 4.457e-5 | C=-0.7355 +/- 0.0408 | 0.9938 +/- 0.0054 | 0.3039 +/- 0.0380 | 3.270 +/- 0.0243 |
| coin | +/- | +/- | A= +/- | B= +/- | C= +/- | +/- | +/- | +/- | |
| 2.27 | sing | 903.482 +/- 0.0064 | 0.6595 +/- 0.0877 | A= 0.3199 +/- 0.0156 | B= -7.248e-4+/- 9.968e-7 | C= 6.816e-1 +/- 8.138e-4 | 0.5146 +/- 0.0073 | 0.0852 +/- 0.0107 | 6.037 +/- 0.0082 |
| coin | +/- | +/- | A= +/- | B= +/- | C= +/- | +/- | +/- | +/- | |
Fit method
Do the fit:
get parameters for line
Then fill 1 histogram with line
Then subtract
TH1F *coin1=new TH1F("coin1","coin1",30,1800,1860);

ntuple->Draw("ADC7*0.604963-49.7001 >>coin1")

TH1F *lin1=new TH1F("lin1","line1",30,1800,1860);

for(int i=1800;i<1861;i++){
lin1->Fill(i,-2028+1.12*i)
}

TH1F *sub1=new TH1F("sub1","sub1",30,1800,1860);

sub1->Add(coin1,1);
sub1->Add(lin1,-1);

sub1->Draw();
A pdf of the Mathematica notebook used to calculate background area, gaussian area, and plot signal/noise vs. activity.
File:AW Background Noise custom4.pdf
All the ROOT fit parameters used to find the background and the resulting peaks.
File:Y-88 Fit Log Scaled&Cut.pdf
Integrating the gaussian of the HpGe detector signal.
File:AW Gaussian Integral2.pdf


