Difference between revisions of "D2O bank"
| (126 intermediate revisions by the same user not shown) | |||
| Line 1: | Line 1: | ||
==Relative photon flux== | ==Relative photon flux== | ||
| + | |||
| + | Relative photon flux obtained during the experiment using D2O target. | ||
[[File:flux_4111.png | 600 px]] | [[File:flux_4111.png | 600 px]] | ||
| Line 41: | Line 43: | ||
[[File:neutron_energy_D2O_bank2.png]] | [[File:neutron_energy_D2O_bank2.png]] | ||
| + | Neutron number vs neutron detector central angle is plotted below: | ||
| + | |||
| + | [[File:neutronNum_angleD2O.png | 500 px]] | ||
| + | |||
| + | ===Neutron energy spectra including BKG and photon peak area=== | ||
| + | |||
| + | [[File:DetE_neutron_energy_D2O_bank_LH.png || 500 px]] | ||
| + | |||
| + | |||
| + | ===Neutron TOF spectrum fit=== | ||
| + | |||
| + | Cumulative neutron ToF spectrum obtained with Det E and fit with the function that is combination of Gaussian and Landau distribution | ||
| + | |||
| + | y = A*PDF[NormalDistribution[<math>\mu</math>,<math>\sigma</math>], x]+m*PDF[LandauDistribution[p, a], x], where A=6800, <math>\mu=119 ns</math>, <math>\sigma=8 ns</math>, m=37000, p=135.25, a=12.08. | ||
| + | |||
| + | [[File:DetE_d2o_tof_fit2.png || 500 px]] | ||
| + | |||
| + | Relative contribution of the photon peak into the neutron region: | ||
| + | |||
| + | {| cellpadding="2" style="border: 1px solid darkgray;" | ||
| + | ! width="400" | | ||
| + | ! width="400" | | ||
| + | |- border="0" | ||
| + | | [[File:DetE_d2o_tof_fit_decomposed2.png|500px|Region 1]] | ||
| + | | [[File:threshold_photon_contamination2.png|500px|Region 2]] | ||
| + | |- align="center" | ||
| + | |Decomposed fit function||Contamination of the the neutron region by photons | ||
| + | |} | ||
| + | |||
| + | Fitting with ROOT: | ||
| + | |||
| + | |||
| + | The tof spectrum obtained with H2O target is presented below: | ||
| + | |||
| + | {| cellpadding="2" style="border: 1px solid darkgray;" | ||
| + | ! width="400" | | ||
| + | ! width="400" | | ||
| + | |- border="0" | ||
| + | | [[File:h2o_root_fit.png|500px|Region 1]] | ||
| + | | [[File:h2o_fit_decomposed.png|500px|Region 2]] | ||
| + | |- align="center" | ||
| + | |Fit of the photon peak || Decomposed fit of the photon peak | ||
| + | |} | ||
| + | |||
| + | |||
| + | {| cellpadding="2" style="border: 1px solid darkgray;" | ||
| + | ! width="400" | | ||
| + | ! width="400" | | ||
| + | |- border="0" | ||
| + | | [[File:h2o_runs_adjusted.png|500px|Region 1]] | ||
| + | | [[File:D2O_runs_notadjausted.png|500px|Region 2]] | ||
| + | |- align="center" | ||
| + | |Fit of the photon peak || Decomposed fit of the photon peak | ||
| + | |} | ||
| + | |||
| + | |||
| + | |||
| + | |||
| + | {| cellpadding="2" style="border: 1px solid darkgray;" | ||
| + | ! width="400" | | ||
| + | ! width="400" | | ||
| + | |- border="0" | ||
| + | | [[File:D2o_runs_adjusted_2.png|500px|Region 1]] | ||
| + | | [[File:D2o_fit_photnpeak_H2O_2.png|500px|Region 2]] | ||
| + | |- align="center" | ||
| + | |Separate ToF spectra superimposed || Fit with the H2O photon peak function | ||
| + | |} | ||
| + | |||
| + | |||
| + | {| cellpadding="2" style="border: 1px solid darkgray;" | ||
| + | ! width="400" | | ||
| + | ! width="400" | | ||
| + | |- border="0" | ||
| + | | [[File:DetE_D2O_H2Ofit.png|500px|Region 1]] | ||
| + | | [[File:DetE_D2O_H2Otot.png|500px|Region 2]] | ||
| + | |- align="center" | ||
| + | |Separate ToF spectra superimposed || Fit with the H2O photon peak function | ||
| + | |} | ||
| + | |||
| + | |||
| + | |||
| + | {| cellpadding="2" style="border: 1px solid darkgray;" | ||
| + | ! width="400" | | ||
| + | ! width="400" | | ||
| + | |- border="0" | ||
| + | | [[File:DetE_d2o_fit_root_tot.png|500px|Region 1]] | ||
| + | | [[File:DetE_d2o_fit_root_decomp.png|500px|Region 2]] | ||
| + | |- align="center" | ||
| + | |Fit function||Contamination of the the neutron region by photons | ||
| + | |} | ||
| + | |||
| + | |||
| + | {| cellpadding="2" style="border: 1px solid darkgray;" | ||
| + | ! width="400" | | ||
| + | ! width="400" | | ||
| + | |- border="0" | ||
| + | | [[File:DetE_d2o_fit_root_tot2.png|500px|Region 1]] | ||
| + | | [[File:DetE_sig_bkg_linfit.png|500px|Region 2]] | ||
| + | |- align="center" | ||
| + | |Fit function|| Fit of the BKG by linear fcn | ||
| + | |} | ||
| + | |||
| + | [[File:Detector_array_setup.png || 500 px]] | ||
| + | |||
| + | |||
| + | Lead shielding thickness in front of the detectors/-HV: | ||
| + | |||
| + | DetE - 4" / E1,E2 -> 1650 V, 1750 V | ||
| + | |||
| + | DetM - 4" / M1,M2 -> 1600 V, 1750 V | ||
| + | |||
| + | DetF - 3" / F1,F2 -> 1700 V, 1700 V | ||
| + | |||
| + | DetG - 2" / G1,G2 -> 1700 V, 1650 V | ||
| + | |||
| + | DetH - 2" / H1,H2 -> 1730 V, 1650 V | ||
| + | |||
| + | DetK - 2" / K1,K2 -> 1755 V, 1600 V | ||
| + | |||
| + | DetI - 2" / I1,I2 -> 1650 V, 1700 V | ||
| + | |||
| + | Neutron singles for every PMT: | ||
| + | |||
| + | [[File:n_singles_DU.png || 550 px]] | ||
| + | |||
| + | |||
| + | The graphical data on the neutron singles: | ||
| + | |||
| + | [[File:n_singles_DU_data.pdf]] | ||
| + | |||
| + | |||
| + | The background was subtracted assuming that it has linear change and the neutron area is above the linear background (see picture above): | ||
| + | |||
| + | [[File:Det_Eff_NObkg4.png || 550 px]] | ||
| + | |||
| + | |||
| + | {| cellpadding="2" style="border: 1px solid darkgray;" | ||
| + | ! width="400" | | ||
| + | ! width="400" | | ||
| + | |- border="0" | ||
| + | | [[File:DetE_d2o_fit_decomp_zoom.png|500px|Region 1]] | ||
| + | | [[File:DetE_d2o_fit_area.png|500px|Region 2]] | ||
| + | |- align="center" | ||
| + | |Fit function||Contamination of the the neutron region by photons | ||
| + | |} | ||
| + | |||
| + | |||
| + | TOF spectrum of the neutrons created in the photofission of DU: | ||
| + | |||
| + | Fitting of the raw neutron ToF spectrum: | ||
| + | |||
| + | |||
| + | {| cellpadding="2" style="border: 1px solid darkgray;" | ||
| + | ! width="400" | | ||
| + | ! width="400" | | ||
| + | |- border="0" | ||
| + | | [[File:DetE_DU_tof_fit_root.png|500px|Region 1]] | ||
| + | | [[File:DetE_DU_tof_fit_area.png|500px|Region 2]] | ||
| + | |- align="center" | ||
| + | |Decomposed fit function||Contamination of the the neutron region by photons | ||
| + | |} | ||
| + | |||
| + | |||
| + | |||
| + | |||
| + | {| cellpadding="2" style="border: 1px solid darkgray;" | ||
| + | ! width="400" | | ||
| + | ! width="400" | | ||
| + | |- border="0" | ||
| + | | [[File:DetE_DU_tof_fit.png|500px|Region 1]] | ||
| + | | [[File:DetE_DU_tof_zoom.png|500px|Region 2]] | ||
| + | |- align="center" | ||
| + | |Decomposed fit function||Contamination of the the neutron region by photons | ||
| + | |} | ||
| + | |||
| + | ==Detector efficiency== | ||
| + | |||
| + | The main experimental setup used to determine the neutron detection efficiencies is shown below: | ||
| + | |||
| + | [[File:detector_layout_wrt_photon2.png]] | ||
| + | |||
| + | The relative neutron yield obtained by weighting the D2 photodisintegration cross section by bremsstahlung photon flux and solid angle of each of the detector is plotted below as a function of the neutron kinetic energy recalculated from the photon energy using simple kinematics: | ||
| + | |||
| + | [[File:weighted_D2_xsection.png | 600 px]] | ||
| + | |||
| + | As an example of the efficiency calculation let's find the efficiency of Det M in terms of the known absolute efficiency of Det E (14%): | ||
| + | |||
| + | For the efficiency calculation see slide 15 of [https://wiki.iac.isu.edu/images/1/13/Technique_diff_xsect2.pdf] | ||
| + | |||
| + | <math>\frac{\epsilon_E}{\epsilon_M} = \frac{N_n^E \cdot Area_M}{N_n^M \cdot Area_E}</math>, <math>\epsilon_M = \epsilon_E \cdot \frac{N_n^M \cdot Area_E}{N_n^E \cdot Area_M}</math> | ||
| + | |||
| + | Without regards to the neutron energy range one gets the following: | ||
| + | |||
| + | <math>\frac{0.14}{\epsilon_M} =\frac{5932 \cdot 7.92E-5}{2982 \cdot 5.83E-5}</math> and, hence, <math>\epsilon_M = 5.1 %</math> | ||
| + | |||
| + | <math>\epsilon_F = 14.8 %</math> | ||
| + | |||
| + | However, doing the same calculation fro the rest of the detectors one will get | ||
| + | |||
| + | <math>\epsilon_G = 33.3 %</math> | ||
| + | |||
| + | <math>\epsilon_H = 113.9 %</math> | ||
| + | |||
| + | <math>\epsilon_K = 126.6 %</math> | ||
| + | |||
| + | <math>\epsilon_I = 117.05 %</math> | ||
| + | |||
| + | In order to get the correct values of the neutron detection efficiency for the detectors I, K and H we did another calibration run where the D2O target was moved towards the neutron detectors as shown below: | ||
| + | |||
| + | [[File:detI_calibr_setup.png]] | ||
| + | |||
| + | The solid angles changed and were obtained from the simulation: | ||
| + | |||
| + | <math>\delta \Omega_G = 0.0037 sr</math> | ||
| + | |||
| + | <math>\delta \Omega_H = 0.0067 sr</math> | ||
| + | |||
| + | <math>\delta \Omega_K = 0.1 sr</math> | ||
| + | |||
| + | <math>\delta \Omega_I = 0.099 sr</math> | ||
| + | |||
| + | |||
| + | The relative neutron yield obtained by weighting the D2 photodisintegration cross section by bremsstahlung photon flux and solid angle of each of the detector is plotted below as a function of the neutron kinetic energy recalculated from the photon energy using simple kinematics: | ||
| + | |||
| + | [[File:DetI_calibr_yield2.png | 600 px]] | ||
| + | |||
| + | From the experimental data it was defined the total number of neutrons detected by the neutron detectors I, K and H during the calibration run: | ||
| + | |||
| + | [[File:detG_calibr_adj_d2o.png | 600 px]] | ||
| + | |||
| + | [[File:detH_calibr_adj_d2o.png | 600 px]] | ||
| + | |||
| + | [[File:detK_calibr_adj_d2o.png | 600 px]] | ||
| + | |||
| + | [[File:detI_calibr_adj_d2o.png | 600 px]] | ||
| + | |||
| + | |||
| + | Nn(I) = 470 | ||
| + | |||
| + | Nn(K) = 3159 | ||
| + | |||
| + | Nn(H) = 2063 | ||
| + | |||
| + | Nn(G) = 437 | ||
| + | |||
| + | Now we can calculate the efficiency of the detectors I, K, G and H in terms of the efficiency of detector E obtained during the regular calibration run: | ||
| + | |||
| + | [[File:det_effcy_table_cumulative2.png | 600 px]] | ||
| + | |||
| + | [[File:23_5vs156_5.png | 600 px]] | ||
| + | |||
| + | ===Data on the relative effcy using Cf-252 and Co-60=== | ||
| + | |||
| + | [[File:n_g_det_relative_effcyDD.png]] | ||
| + | |||
| + | |||
| + | ===Data on the effcy using neutron single events from U-238 fission=== | ||
| + | |||
| + | In order to calculate the neutron efficiency the data on the photofission of U-238 were taken from [https://wiki.iac.isu.edu/index.php/Single_neutron_angular_distribution]. Also the efficiency of the Det E was measured separately and was found to be 14 %. It was asssumed that the single neutrons from FFs were emitted isotropically. Hence, the difference in the neutron counts for different detectors is introduced by the solid angle and intrinsic efficiency differences. Since the efficiency of the Det E is known (14%) it is possible calculate the neutron counts for the case when the neutron efficiency is 100%: 13877*100%/14% = 99121 neutrons. In the case 100% efficiency for all the detectors the number of neutrons detected is defined by the difference in solid angle. So it is possible to find the expected number of neutrons in the case of 100% efficient detecotrs in therms of the expected number of neutrons in Det E and solid angle difference: for Det M we get the ratio of the solid angles to be 1.118 (see column 4) and hence the number of neutrons detected by 100% efficient Det M is equal to 99121*1.118 = 110845.5 (see column 5). Real value of x% efficiency of the Det M can be found using experimental value of the single neutrons detected and the number of neutrons for 100% efficient Det M as x% = 11,257.0*100%/110845.5 = 10.2% (see column 6). Same algorithm can be applied for the rest of the detectors. | ||
| + | |||
| + | [[File:singles_U_238_effcy.png]] | ||
| + | |||
| + | ==Energy uncertainty issue== | ||
Statistical errors on the number of neutrons per energy bin are not bad, however, big uncertainties in energy come due to the wide width of the photon peak: | Statistical errors on the number of neutrons per energy bin are not bad, however, big uncertainties in energy come due to the wide width of the photon peak: | ||
[[File:Uncertainties_neutronEnergy.jpg | 500 px]] | [[File:Uncertainties_neutronEnergy.jpg | 500 px]] | ||
Latest revision as of 20:27, 3 January 2014
Relative photon flux
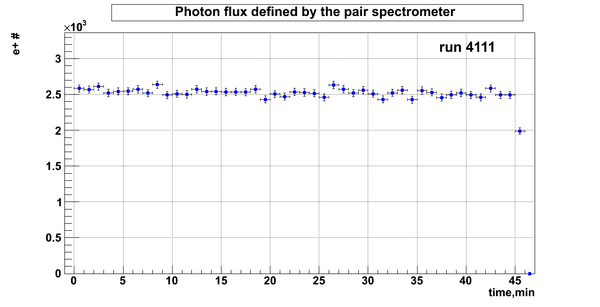
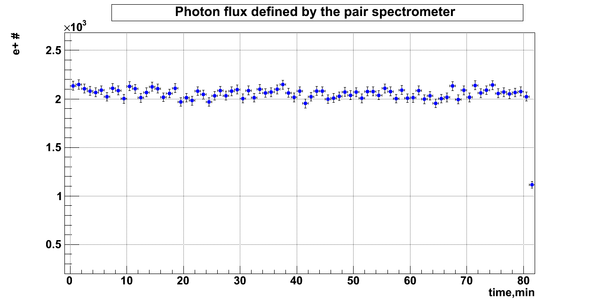
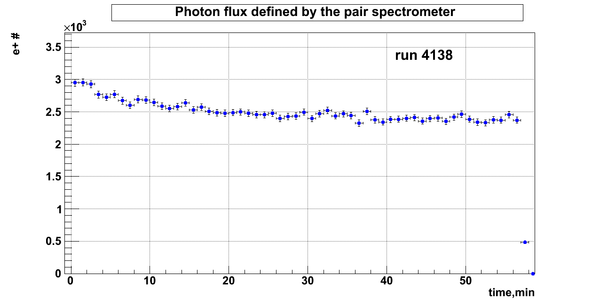
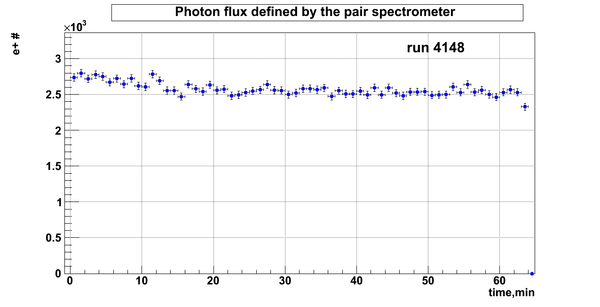
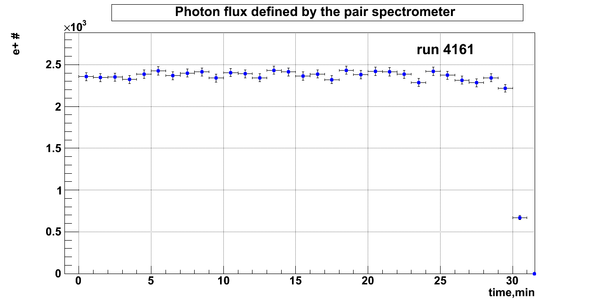
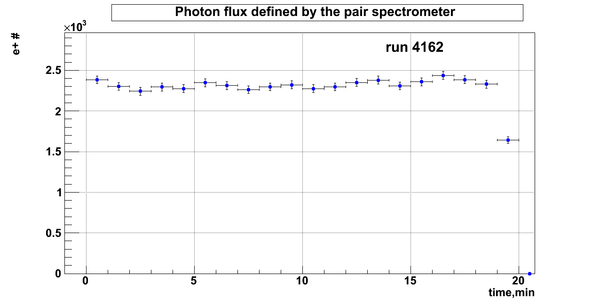
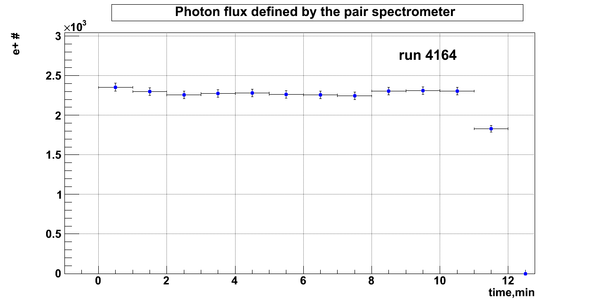
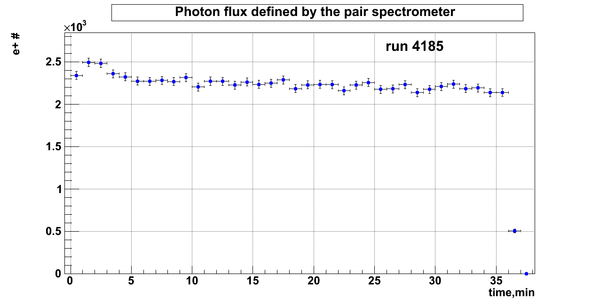
Relative photon flux obtained during the experiment using D2O target.
Normalization?
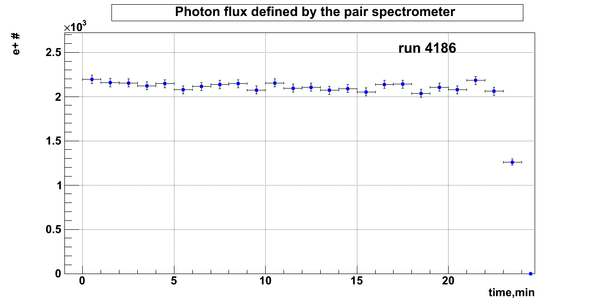
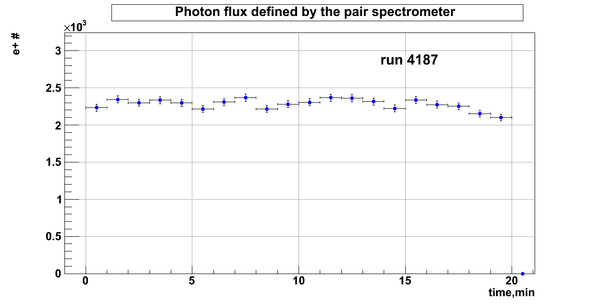
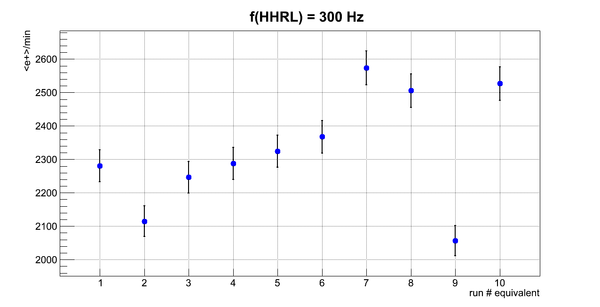
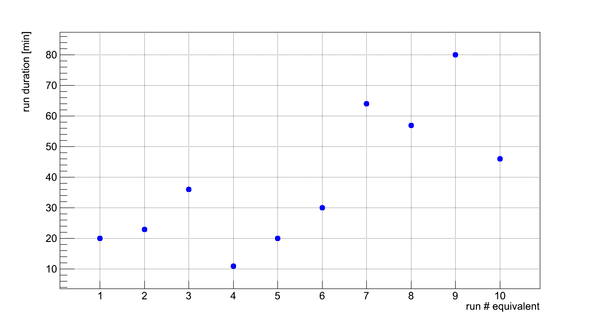
Flux fluctuation over the runs:
run # equivalent 1 corresponds to run 4187, 2 - 4186, 3 - 4185, 4 - 4164, 5 - 4162, 6 - 4161, 7 - 4148, 8 - 4138, 9 - 4126, 10 - 4111.
The thing is that the pair spectrometer is sensitive to the low energy background which may be present in the beam (e- beam finite size and, hence, scraping) so the value of the flux may be affected by low energy component. This thing may not be reflected in the number of neutrons detected by the neutron detectors. So, it is arguable that the pair spectrometer can be used for the flux normalization procedure. One has to investigate the energy spectra of the positrons detected.
Neutron energy spectra
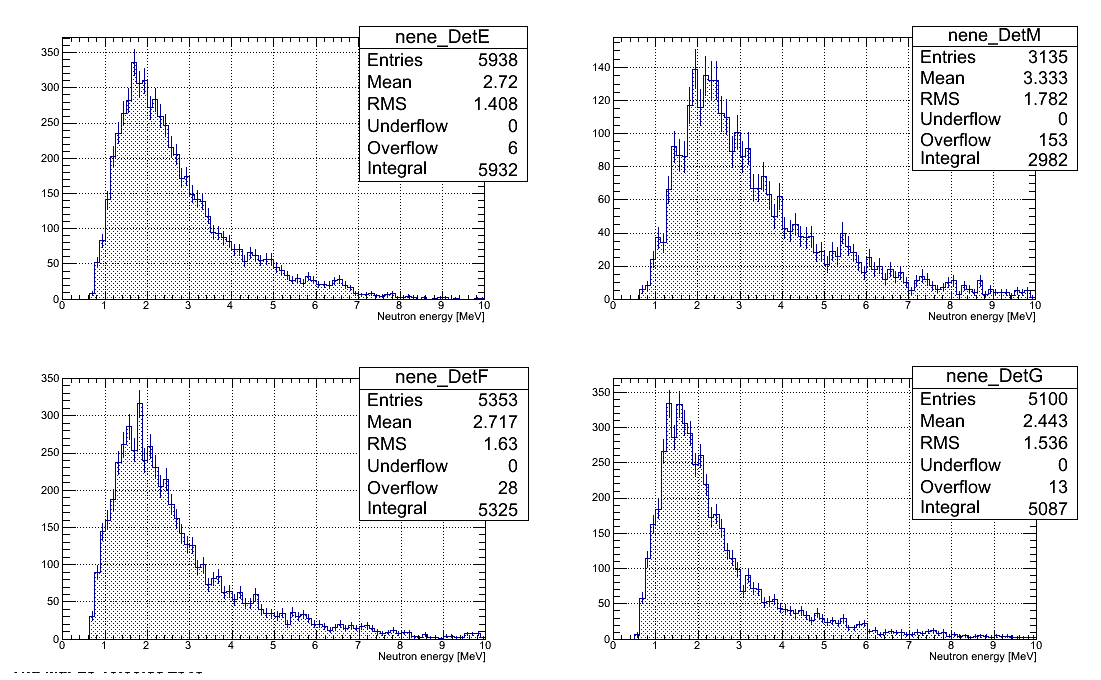
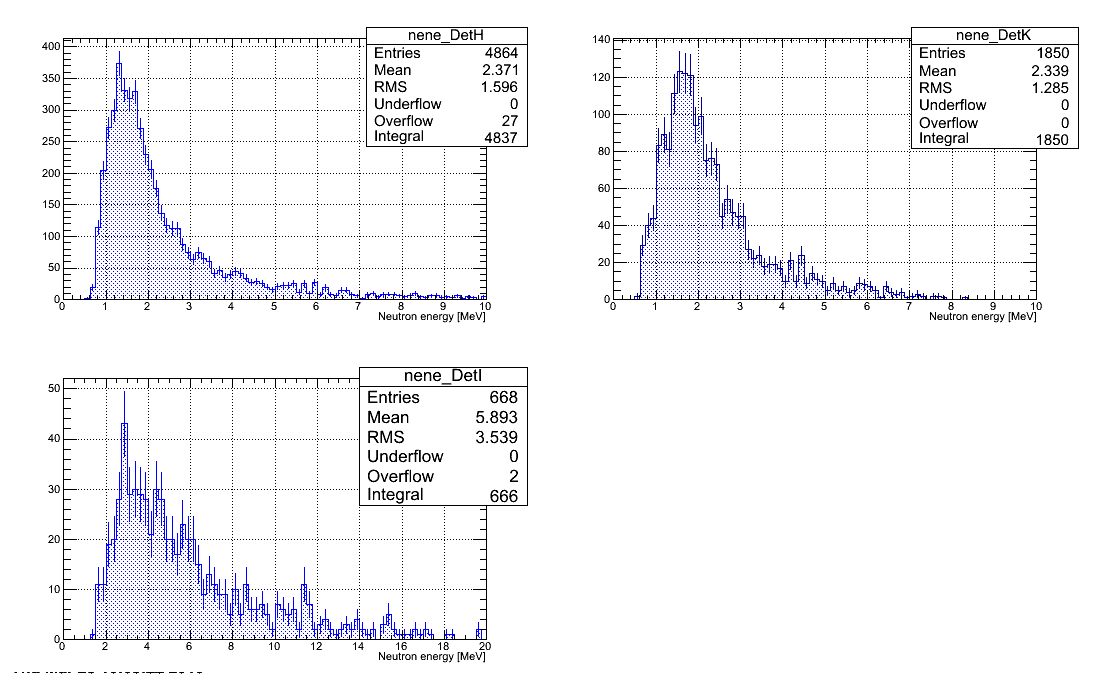
Neutron energy spectra restored from all the runs with D2O target are plotted below. Statistical error bars only presented. All the histograms have same number of channels.
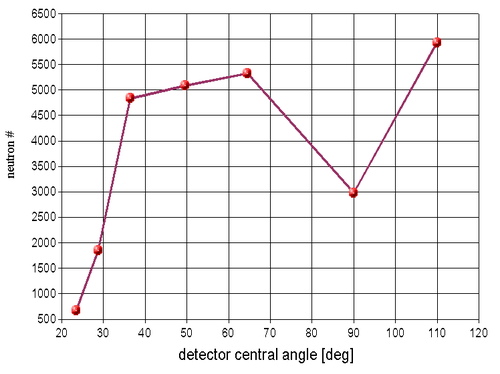
Neutron number vs neutron detector central angle is plotted below:
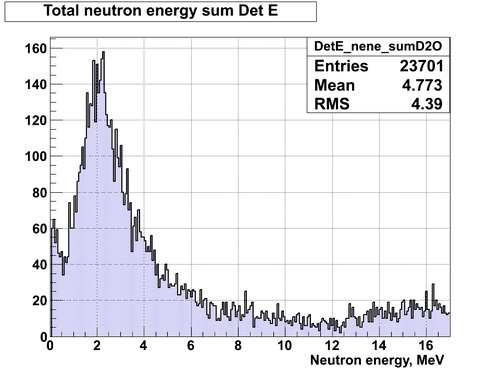
Neutron energy spectra including BKG and photon peak area
Neutron TOF spectrum fit
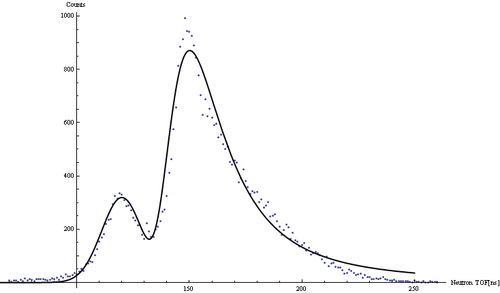
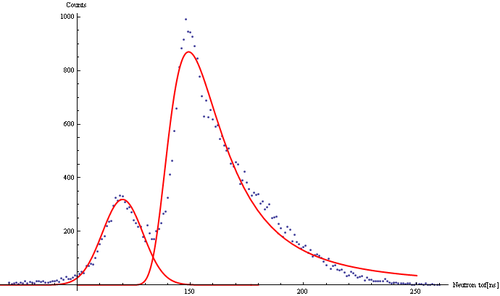
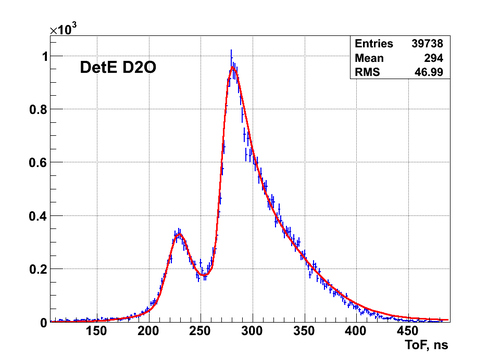
Cumulative neutron ToF spectrum obtained with Det E and fit with the function that is combination of Gaussian and Landau distribution
y = A*PDF[NormalDistribution[,], x]+m*PDF[LandauDistribution[p, a], x], where A=6800, , , m=37000, p=135.25, a=12.08.
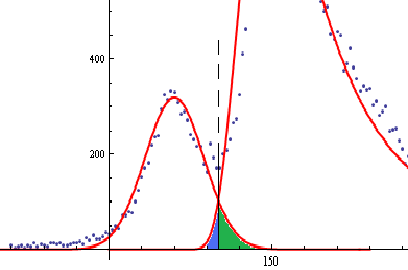
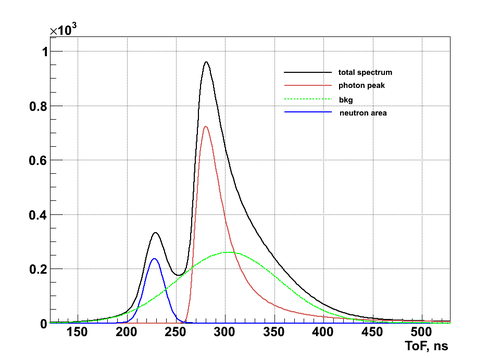
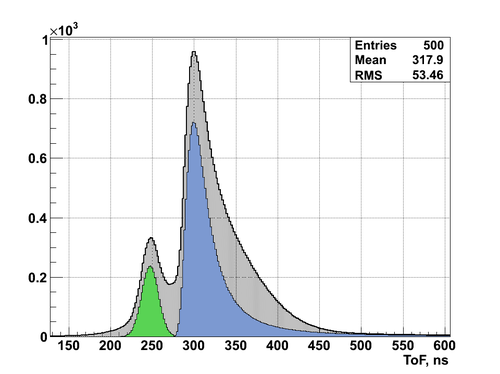
Relative contribution of the photon peak into the neutron region:
|
|
| Decomposed fit function | Contamination of the the neutron region by photons |
Fitting with ROOT:
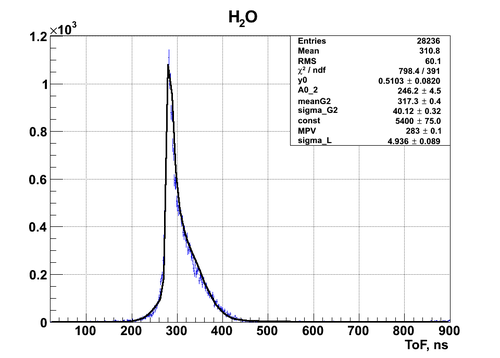
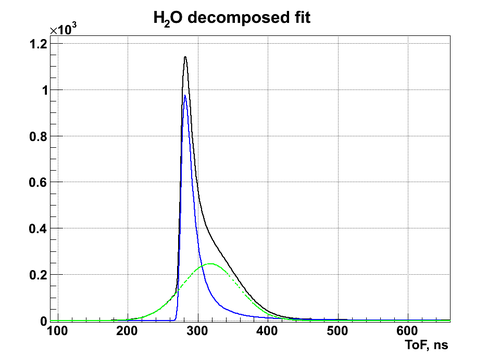
The tof spectrum obtained with H2O target is presented below:
|
|
| Fit of the photon peak | Decomposed fit of the photon peak |
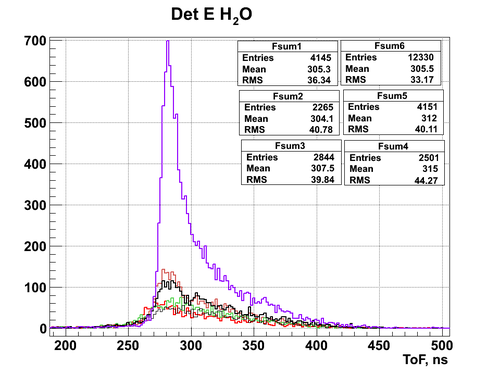
|
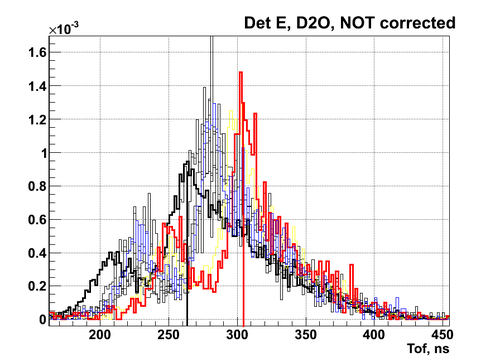
|
| Fit of the photon peak | Decomposed fit of the photon peak |
|
|
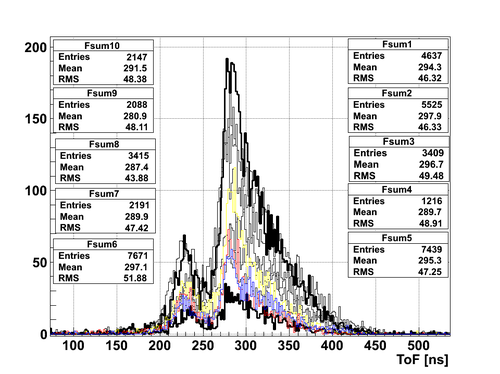
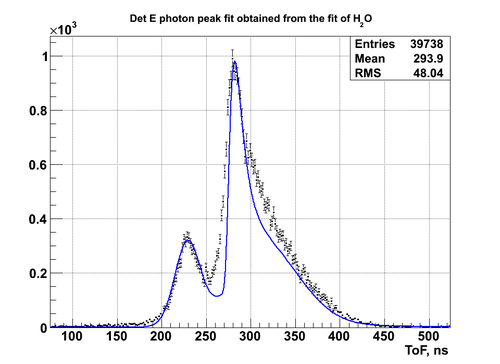
| Separate ToF spectra superimposed | Fit with the H2O photon peak function |
|
|
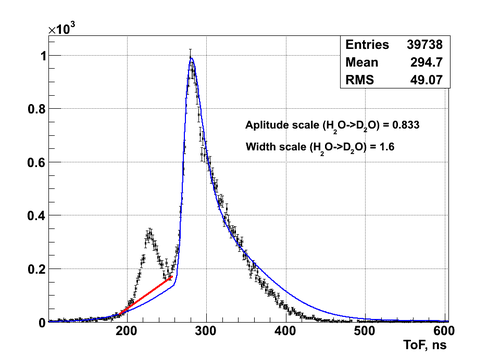
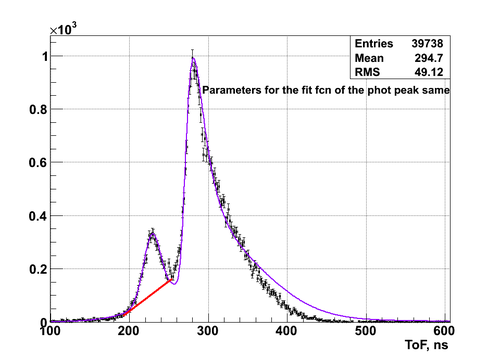
| Separate ToF spectra superimposed | Fit with the H2O photon peak function |
|
|
| Fit function | Contamination of the the neutron region by photons |
|
|
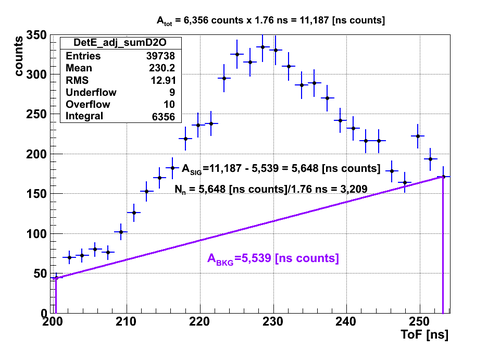
| Fit function | Fit of the BKG by linear fcn |
Lead shielding thickness in front of the detectors/-HV:
DetE - 4" / E1,E2 -> 1650 V, 1750 V
DetM - 4" / M1,M2 -> 1600 V, 1750 V
DetF - 3" / F1,F2 -> 1700 V, 1700 V
DetG - 2" / G1,G2 -> 1700 V, 1650 V
DetH - 2" / H1,H2 -> 1730 V, 1650 V
DetK - 2" / K1,K2 -> 1755 V, 1600 V
DetI - 2" / I1,I2 -> 1650 V, 1700 V
Neutron singles for every PMT:
The graphical data on the neutron singles:
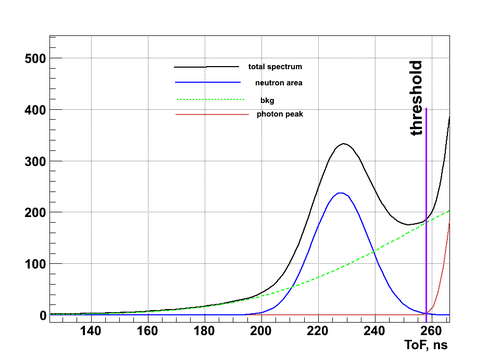
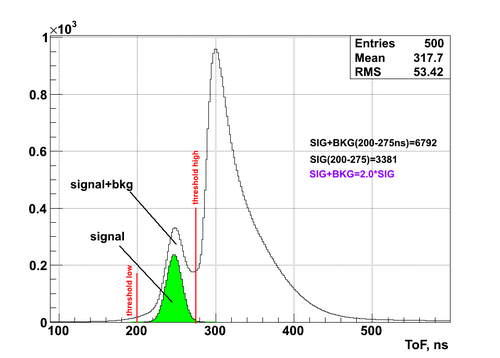
The background was subtracted assuming that it has linear change and the neutron area is above the linear background (see picture above):
|
|
| Fit function | Contamination of the the neutron region by photons |
TOF spectrum of the neutrons created in the photofission of DU:
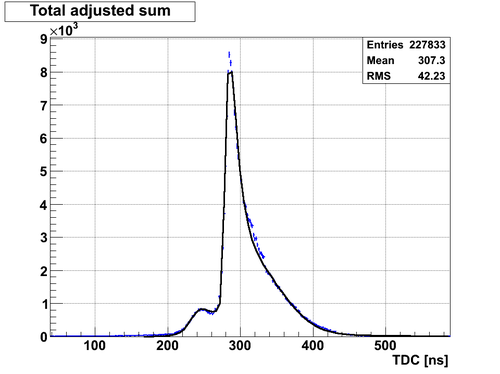
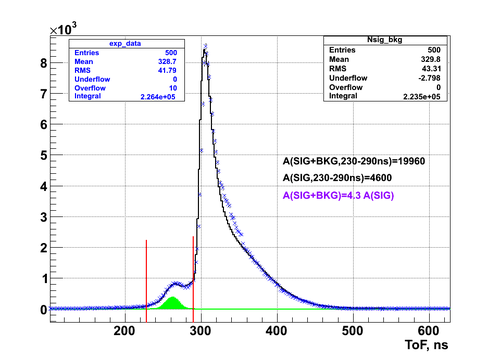
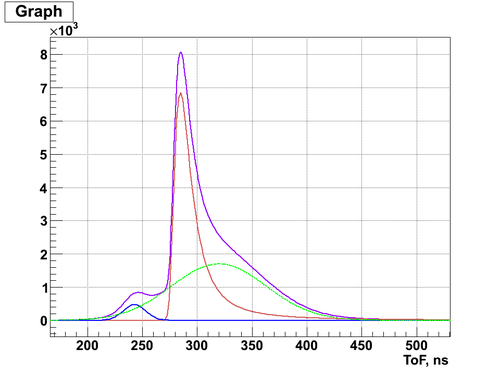
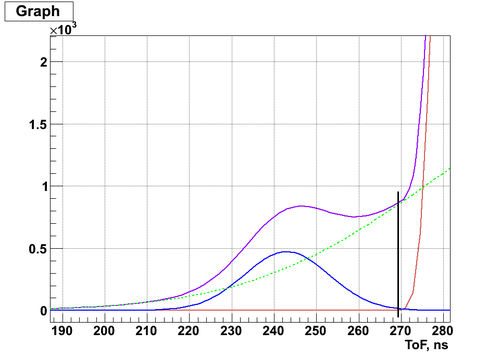
Fitting of the raw neutron ToF spectrum:
|
|
| Decomposed fit function | Contamination of the the neutron region by photons |
|
|
| Decomposed fit function | Contamination of the the neutron region by photons |
Detector efficiency
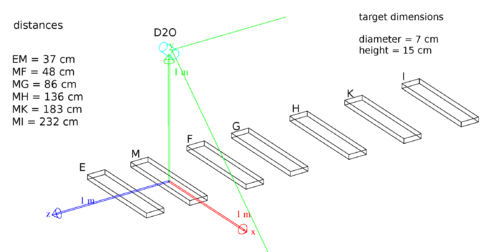
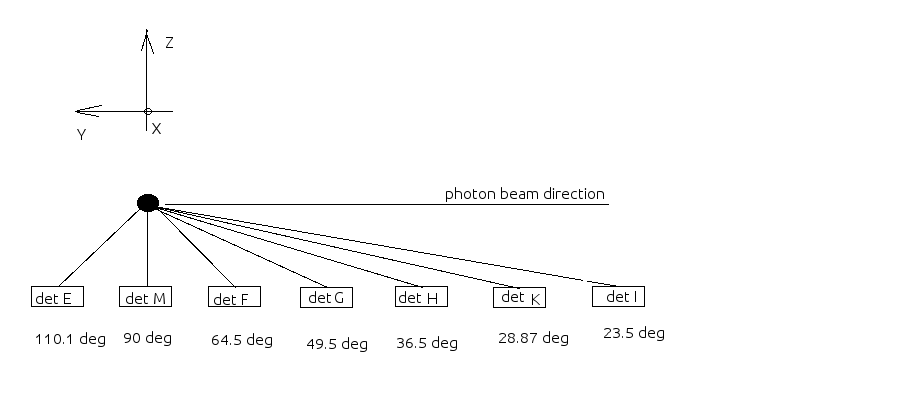
The main experimental setup used to determine the neutron detection efficiencies is shown below:
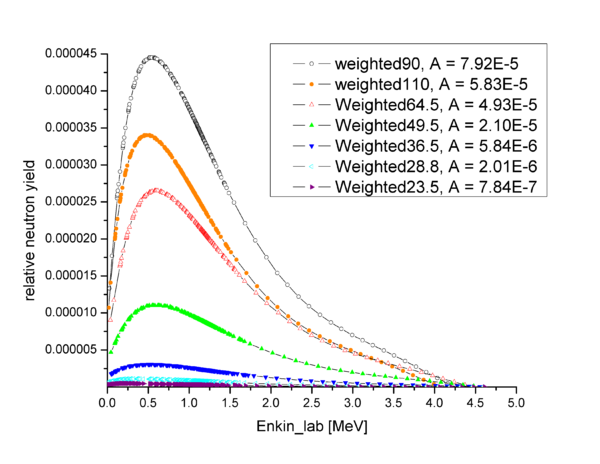
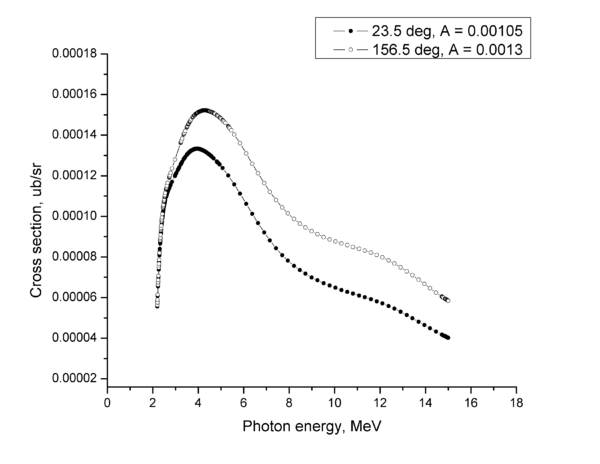
The relative neutron yield obtained by weighting the D2 photodisintegration cross section by bremsstahlung photon flux and solid angle of each of the detector is plotted below as a function of the neutron kinetic energy recalculated from the photon energy using simple kinematics:
As an example of the efficiency calculation let's find the efficiency of Det M in terms of the known absolute efficiency of Det E (14%):
For the efficiency calculation see slide 15 of [1]
,
Without regards to the neutron energy range one gets the following:
and, hence,
However, doing the same calculation fro the rest of the detectors one will get
In order to get the correct values of the neutron detection efficiency for the detectors I, K and H we did another calibration run where the D2O target was moved towards the neutron detectors as shown below:
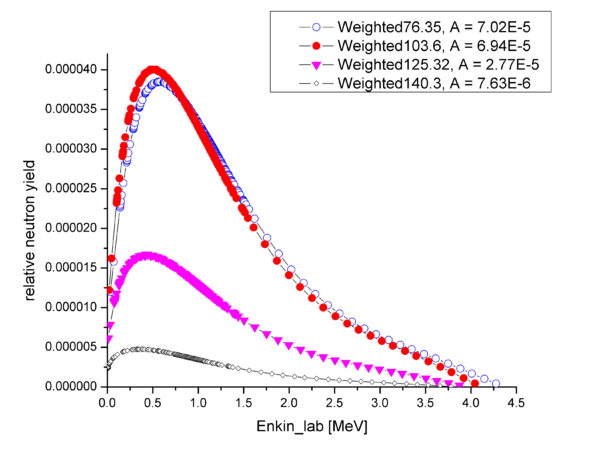
The solid angles changed and were obtained from the simulation:
The relative neutron yield obtained by weighting the D2 photodisintegration cross section by bremsstahlung photon flux and solid angle of each of the detector is plotted below as a function of the neutron kinetic energy recalculated from the photon energy using simple kinematics:
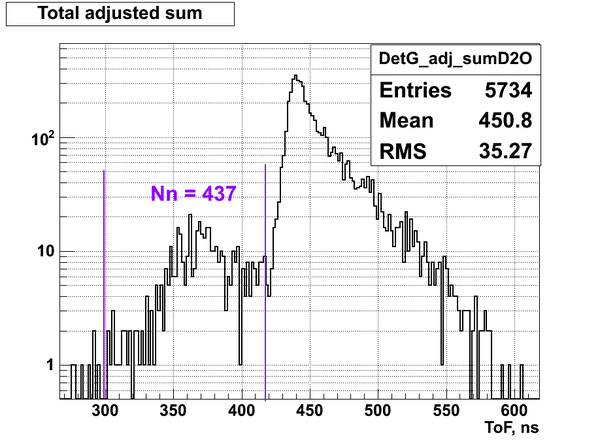
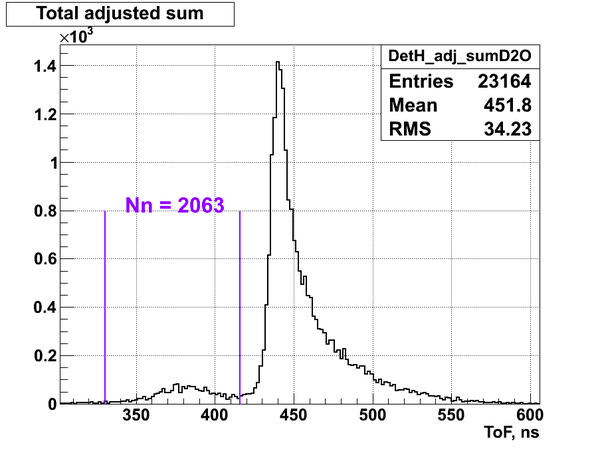
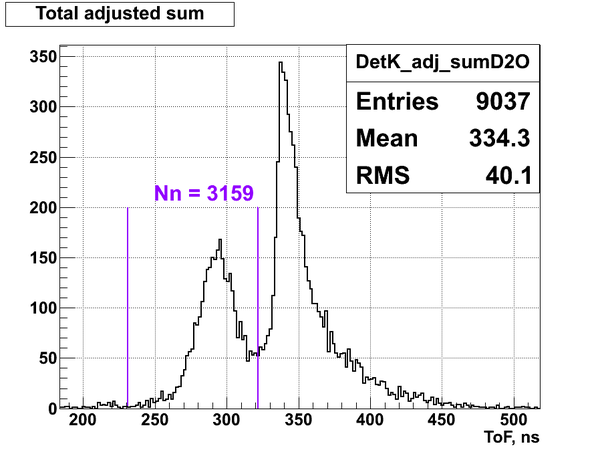
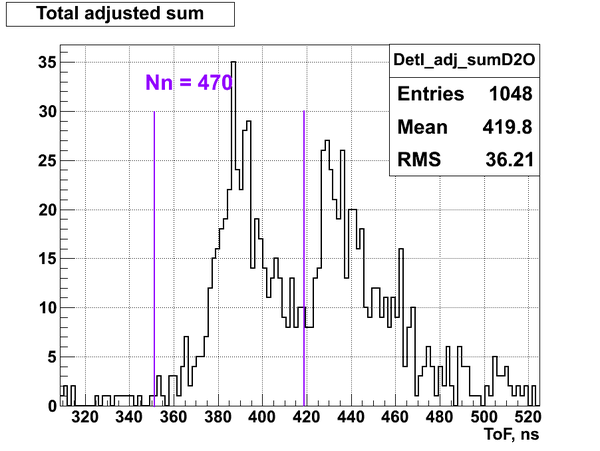
From the experimental data it was defined the total number of neutrons detected by the neutron detectors I, K and H during the calibration run:
Nn(I) = 470
Nn(K) = 3159
Nn(H) = 2063
Nn(G) = 437
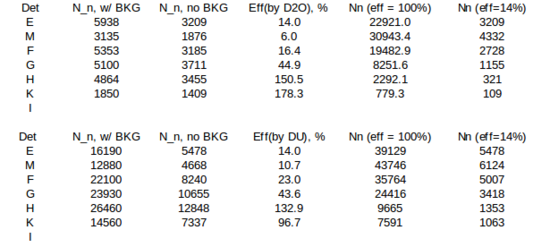
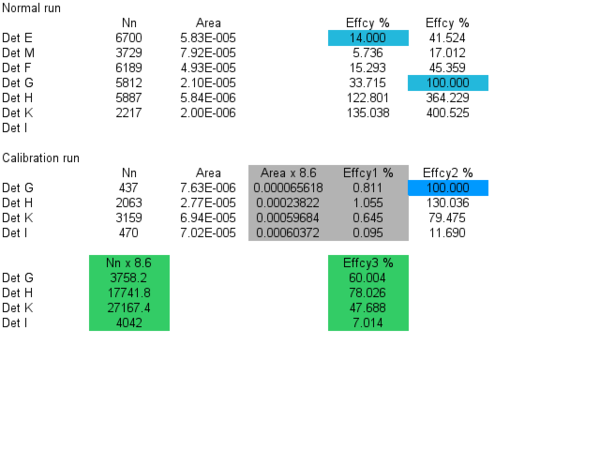
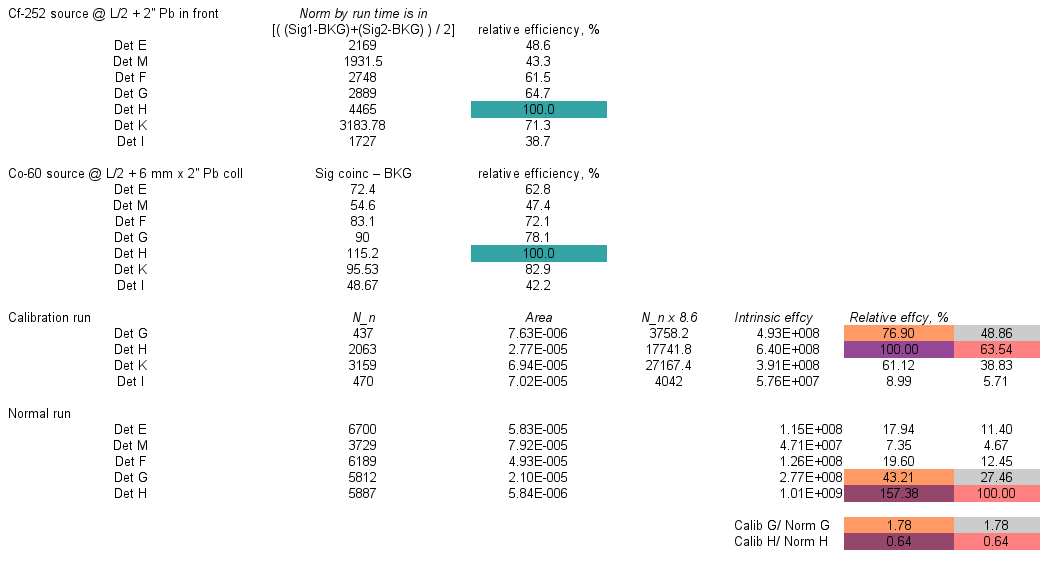
Now we can calculate the efficiency of the detectors I, K, G and H in terms of the efficiency of detector E obtained during the regular calibration run:
Data on the relative effcy using Cf-252 and Co-60
Data on the effcy using neutron single events from U-238 fission
In order to calculate the neutron efficiency the data on the photofission of U-238 were taken from [2]. Also the efficiency of the Det E was measured separately and was found to be 14 %. It was asssumed that the single neutrons from FFs were emitted isotropically. Hence, the difference in the neutron counts for different detectors is introduced by the solid angle and intrinsic efficiency differences. Since the efficiency of the Det E is known (14%) it is possible calculate the neutron counts for the case when the neutron efficiency is 100%: 13877*100%/14% = 99121 neutrons. In the case 100% efficiency for all the detectors the number of neutrons detected is defined by the difference in solid angle. So it is possible to find the expected number of neutrons in the case of 100% efficient detecotrs in therms of the expected number of neutrons in Det E and solid angle difference: for Det M we get the ratio of the solid angles to be 1.118 (see column 4) and hence the number of neutrons detected by 100% efficient Det M is equal to 99121*1.118 = 110845.5 (see column 5). Real value of x% efficiency of the Det M can be found using experimental value of the single neutrons detected and the number of neutrons for 100% efficient Det M as x% = 11,257.0*100%/110845.5 = 10.2% (see column 6). Same algorithm can be applied for the rest of the detectors.
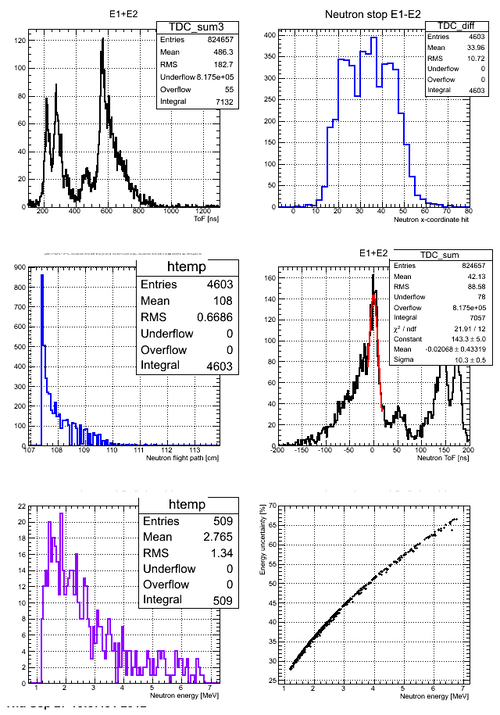
Energy uncertainty issue
Statistical errors on the number of neutrons per energy bin are not bad, however, big uncertainties in energy come due to the wide width of the photon peak:
