Difference between revisions of "Single neutron angular distribution"
| Line 184: | Line 184: | ||
==Relative detection efficiency== | ==Relative detection efficiency== | ||
| − | The relative neutron detection efficiency was calculated in the following way. Det H was chosen to | + | The relative neutron detection efficiency was calculated in the following way. Det H was chosen to be the reference detector. The neutron energy spectra were binned and the ratio of the neutron number detected by the neutron detector under consideration to the neutron number detected by Det H was calculated for the specific neutron energy bin. Also a cut at 1 MeV was applied to remove the noise in the neutron energy spectra. |
So the relative efficiency plot should be understood as follows: the dots on the plots represent the high energy cut value and the full energy range where the number of single neutrons was counted is from 1 MeV up to the point on the plot. | So the relative efficiency plot should be understood as follows: the dots on the plots represent the high energy cut value and the full energy range where the number of single neutrons was counted is from 1 MeV up to the point on the plot. | ||
Revision as of 15:43, 6 August 2013
The data on the single neutron angular distribution were extracted from the experimental data. All production runs with DU target were processed.
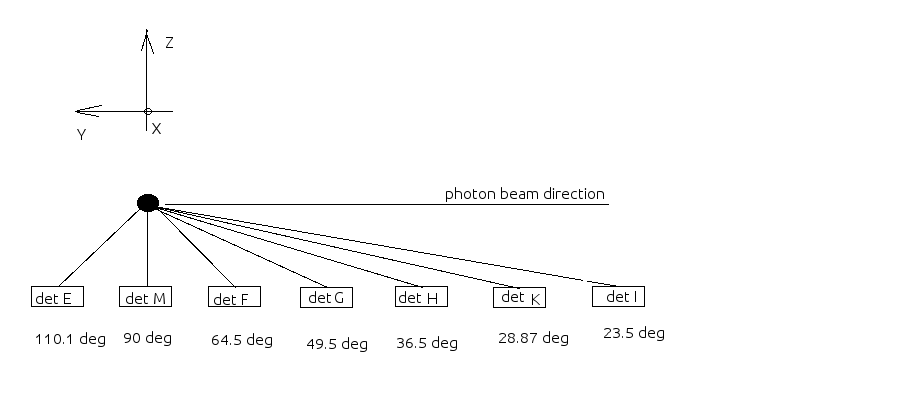
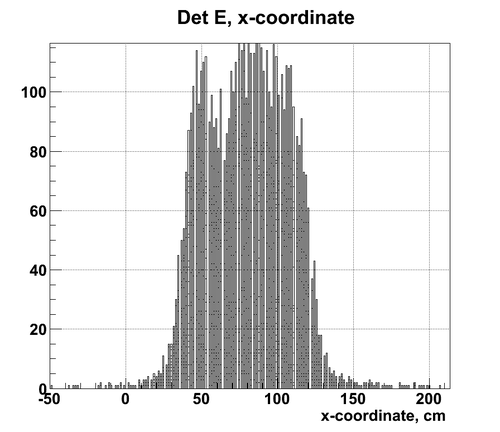
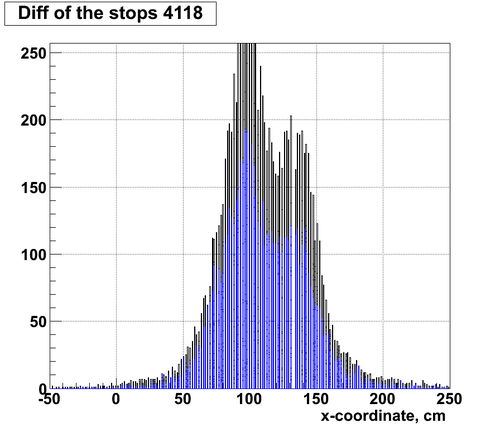
It was observed the angle between single neutron trajectory hitting the detector surface in different x-coordinates and incident photon direction for each of the plastic paddle detectors. This geometry is presented below:
Below each detector there is calculated (using the geometry) value of the angle between the photon beam and the neutron central trajectory hitting the detector.
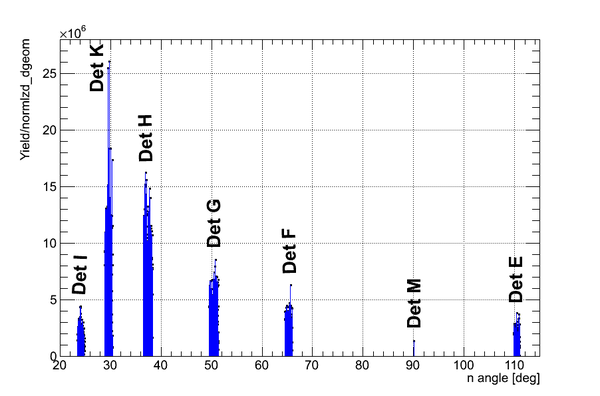
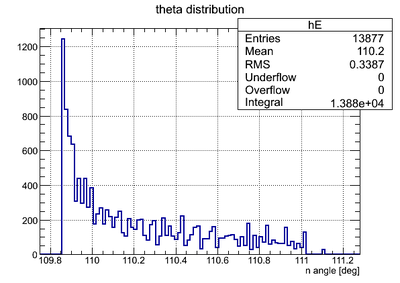
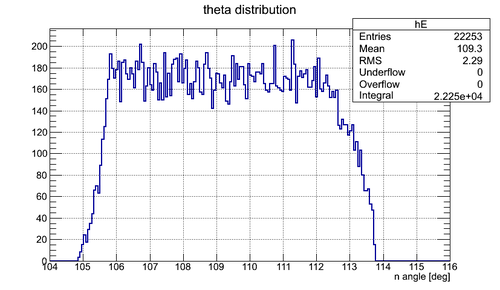
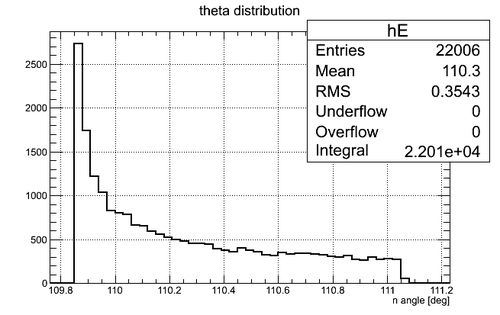
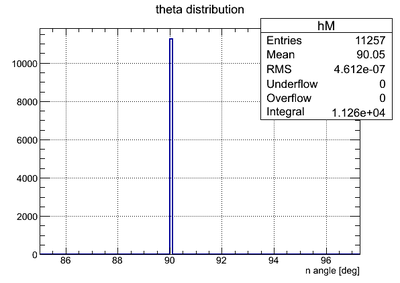
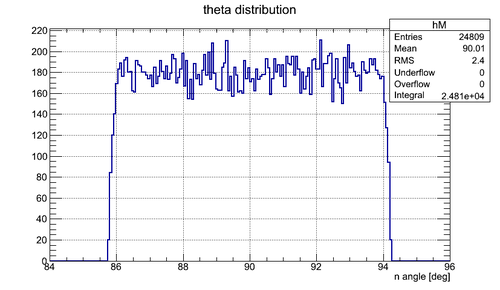
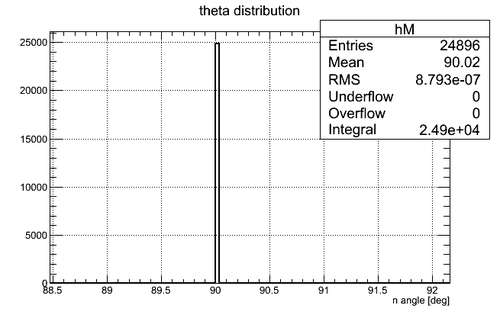
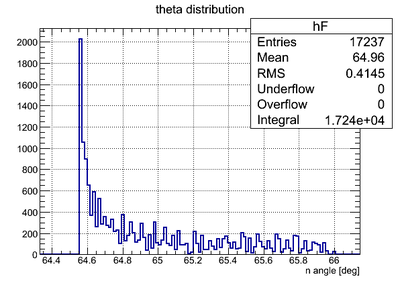
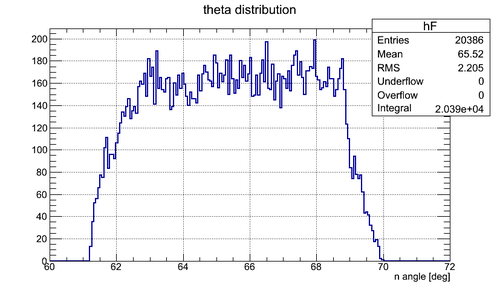
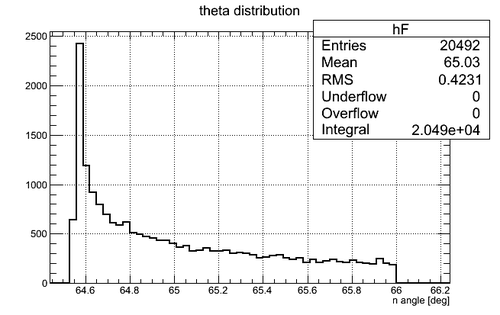
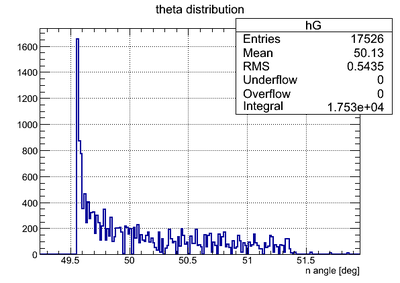
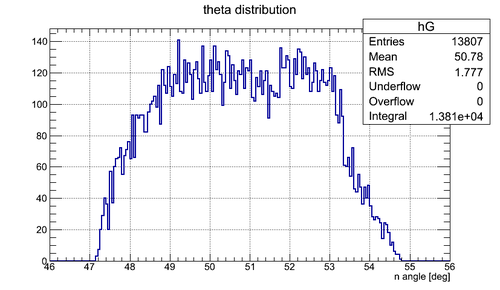
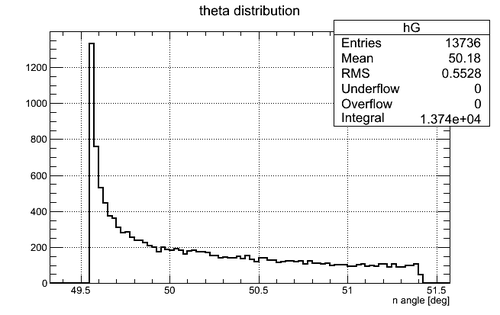
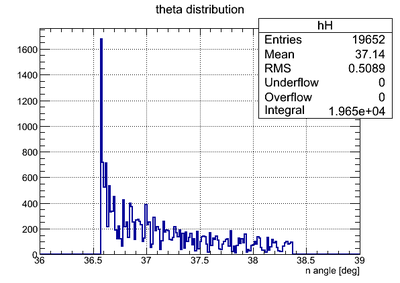
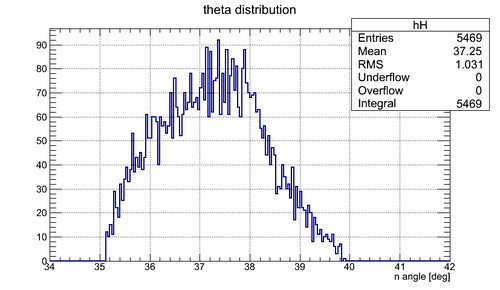
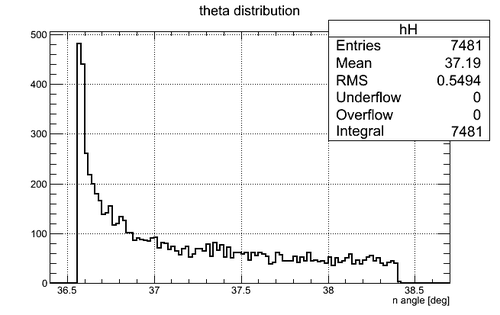
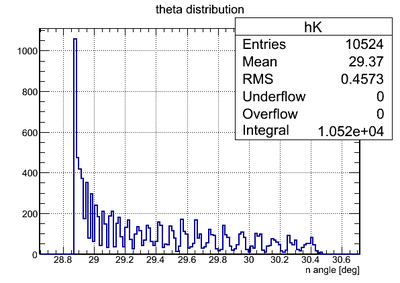
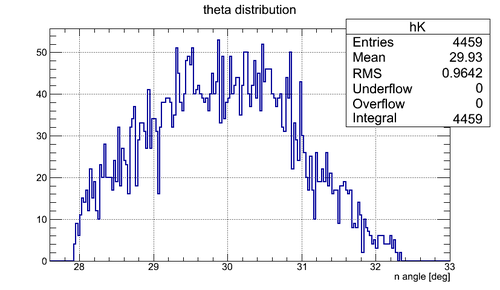
The single neutron angular distribution for each detector extracted from the experimental data and simulation is presented below. In the simulation 3E+6 neutrons were sampled from the point source placed at the positipon of the target isotropically in 4pi.
Detector E:
| Experiment | Simulation | Simulation |
|---|---|---|
|
|
|
| Experiment | Simulation w/ y-resolution; Solid angle = 0.093 sr | Simulation w/o y-resolution; Solid angle = 0.092 sr |
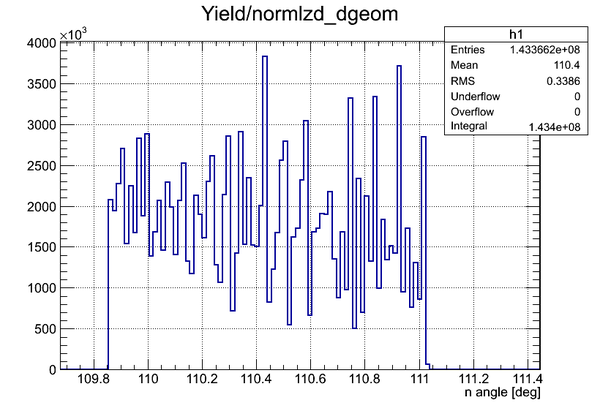
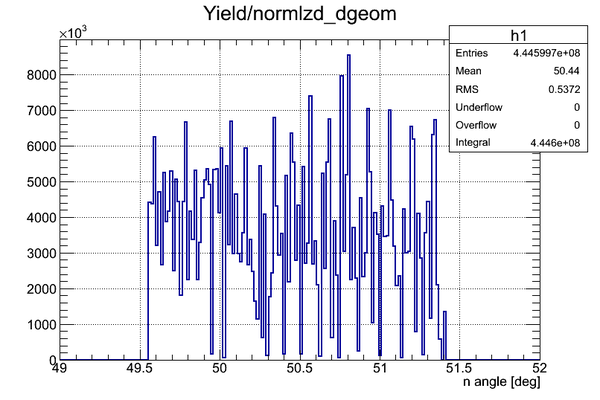
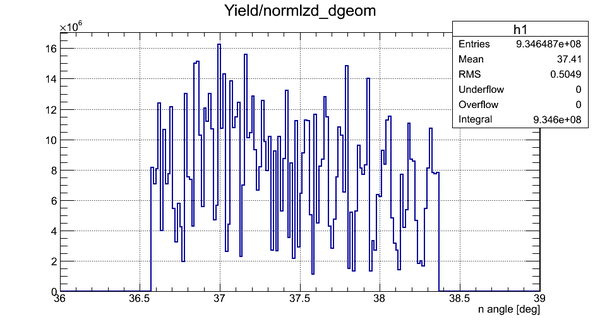
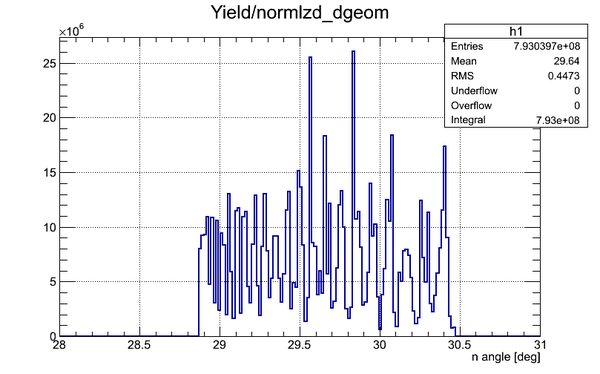
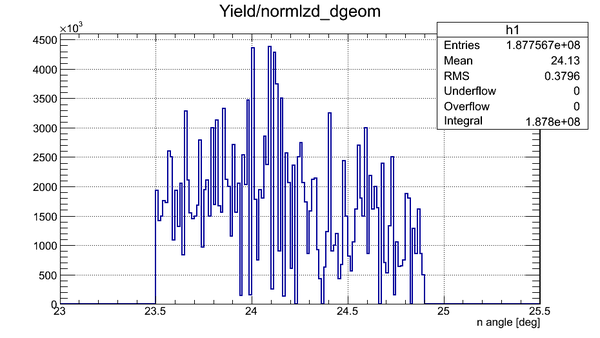
After the normalization of simulated single neutron angular distribution (w/o y-resolution) to the total number of neutrons sampled and division of the experimental single neutron angular distribution by the normalized simulation data it was obtained the following single neutron angular distribution for Det E:
Detector M:
| Experiment | Simulation | Simulation |
|---|---|---|
|
|
|
| Experiment | Simulation w/ y-resolution; Solid angle = 0.104 sr | Simulation w/o y-resolution; Solid angle = 0.104 sr |
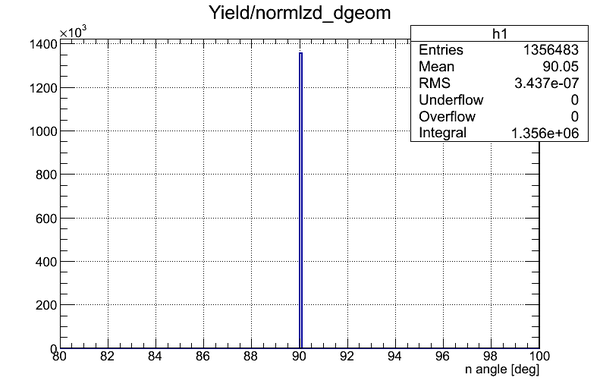
After the normalization of simulated single neutron angular distribution (w/o y-resolution) to the total number of neutrons sampled and division of the experimental single neutron angular distribution by the normalized simulation data it was obtained the following single neutron angular distribution for Det M:
Detector F:
| Experiment | Simulation | Simulation |
|---|---|---|
|
|
|
| Experiment | Simulation w/ y-resolution; Solid angle = 0.085 sr | Simulation w/o y-resolution; Solid angle = 0.086 sr |
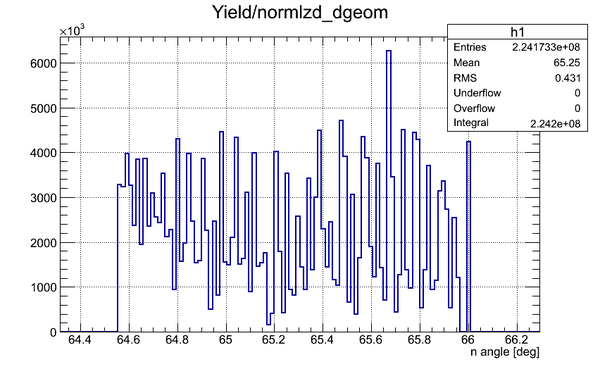
After the normalization of simulated single neutron angular distribution (w/o y-resolution) to the total number of neutrons sampled and division of the experimental single neutron angular distribution by the normalized simulation data it was obtained the following single neutron angular distribution for Det F:
Detector G:
| Experiment | Simulation | Simulation |
|---|---|---|
|
|
|
| Experiment | Simulation w/ y-resolution; Solid angle = 0.058 sr | Simulation w/o y-resolution; Solid angle = 0.057 sr |
After the normalization of simulated single neutron angular distribution (w/o y-resolution) to the total number of neutrons sampled and division of the experimental single neutron angular distribution by the normalized simulation data it was obtained the following single neutron angular distribution for Det G:
Detector H:
| Experiment | Simulation | Simulation |
|---|---|---|
|
|
|
| Experiment | Simulation w/ y-resolution; Solid angle = 0.023 sr | Simulation w/o y-resolution; Solid angle = 0.031 sr |
After the normalization of simulated single neutron angular distribution (w/o y-resolution) to the total number of neutrons sampled and division of the experimental single neutron angular distribution by the normalized simulation data it was obtained the following single neutron angular distribution for Det H:
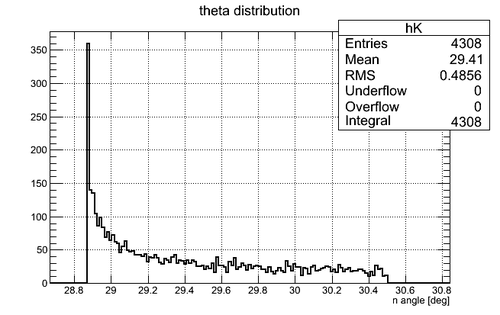
Detector K:
| Experiment | Simulation | Simulation |
|---|---|---|
|
|
|
| Experiment | Simulation w/ y-resolution; Solid angle = 0.018 sr | Simulation w/o y-resolution; Solid angle = 0.018 sr |
After the normalization of simulated single neutron angular distribution (w/o y-resolution) to the total number of neutrons sampled and division of the experimental single neutron angular distribution by the normalized simulation data it was obtained the following single neutron angular distribution for Det K:
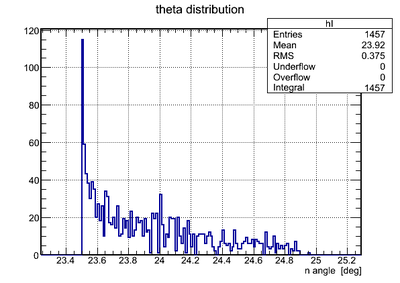
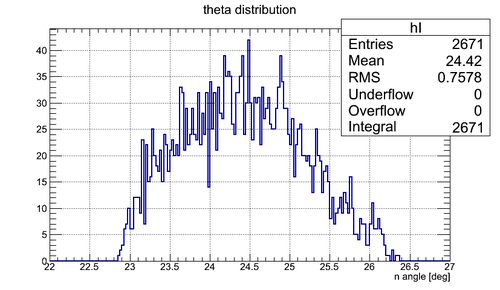
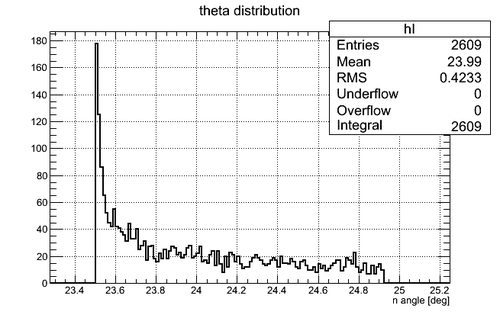
Detector I:
| Experiment | Simulation | Simulation |
|---|---|---|
|
|
|
| Experiment | Simulation w/ y-resolution; Solid angle = 0.011 sr | Simulation w/o y-resolution; Solid angle = 0.011 sr |
After the normalization of simulated single neutron angular distribution (w/o y-resolution) to the total number of neutrons sampled and division of the experimental single neutron angular distribution by the normalized simulation data it was obtained the following single neutron angular distribution for Det I:
As can be seen there is no overlap in the single neutron angular distributions for the neutron detectors and the normalization of simulated single neutron angular distribution (w/o y-resolution) to the total number of neutrons sampled and division of the experimental single neutron angular distribution by the normalized simulation data shows that the angular distribution is close to be flat for all the neutron detectors.
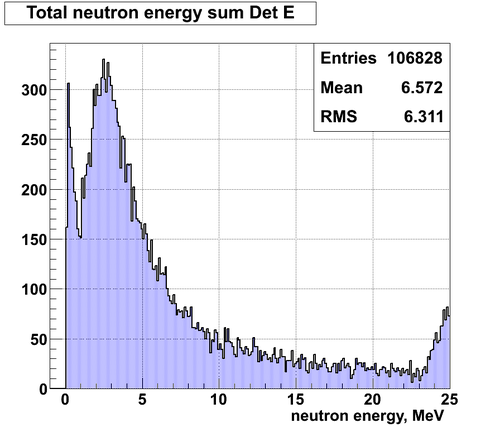
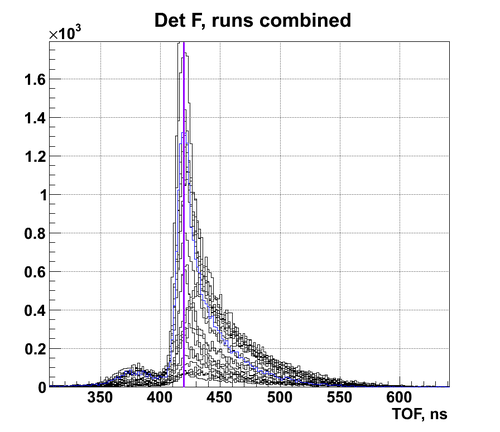
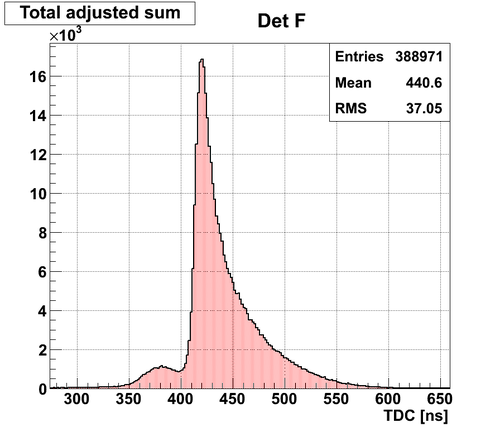
Single neutron energy spectra
Det E
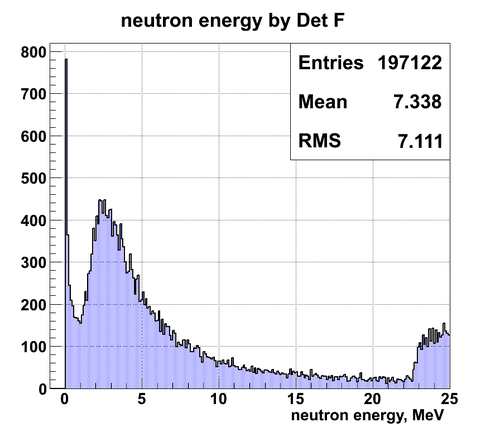
Det F
Single neutron energy bank
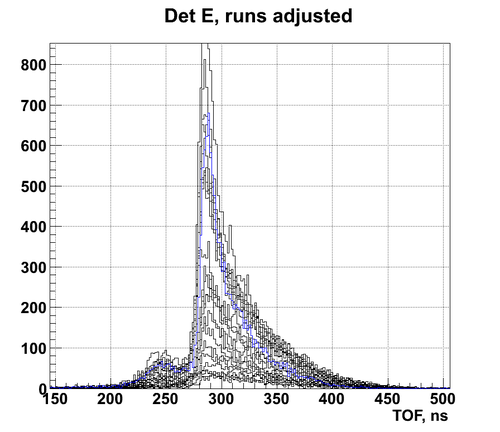
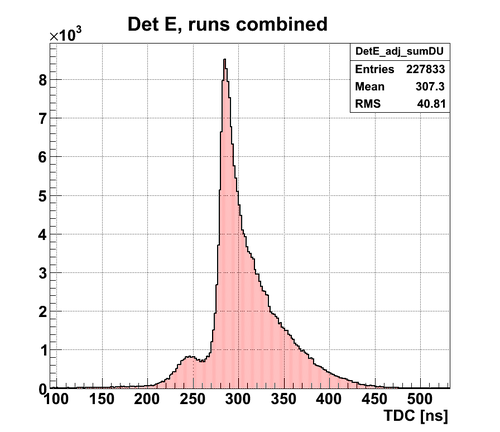
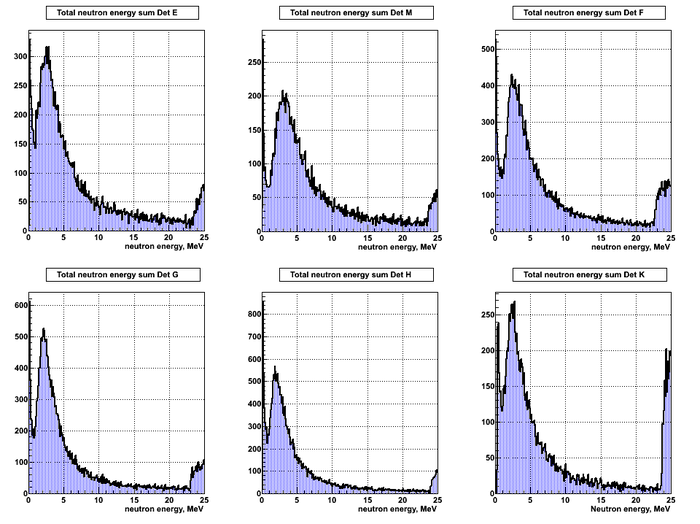
After processing of all data obtained via the rest of the detectors the following single neutron energy spectra were obtained:
Relative detection efficiency
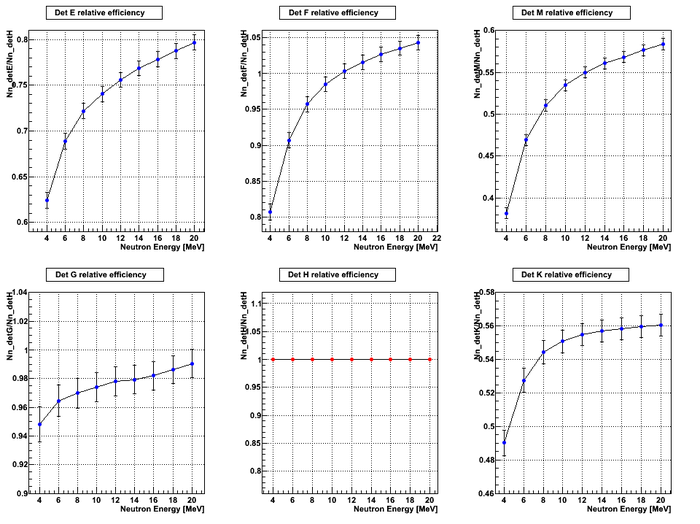
The relative neutron detection efficiency was calculated in the following way. Det H was chosen to be the reference detector. The neutron energy spectra were binned and the ratio of the neutron number detected by the neutron detector under consideration to the neutron number detected by Det H was calculated for the specific neutron energy bin. Also a cut at 1 MeV was applied to remove the noise in the neutron energy spectra.
So the relative efficiency plot should be understood as follows: the dots on the plots represent the high energy cut value and the full energy range where the number of single neutrons was counted is from 1 MeV up to the point on the plot.
Error bars in the relative efficiency plots represent propagated statistical uncertainties on the neutron number in the specific energy range.
