Difference between revisions of "2n Position resolution"
Jump to navigation
Jump to search
| Line 3: | Line 3: | ||
[[File:convolution_deconvolution_stepFcn.png | 600px]] | [[File:convolution_deconvolution_stepFcn.png | 600px]] | ||
| + | |||
| + | If we take narrower response function we will get | ||
| + | |||
| + | [[File:convolution_deconvolution_stepFcn2.png | 600px]] | ||
==FFT application== | ==FFT application== | ||
Revision as of 15:04, 26 April 2013
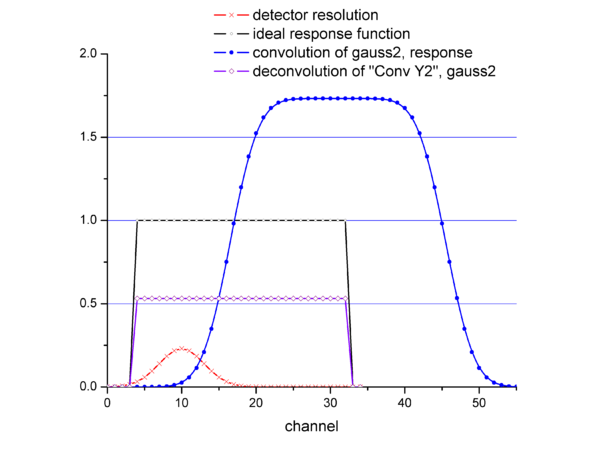
FFT algorithm test
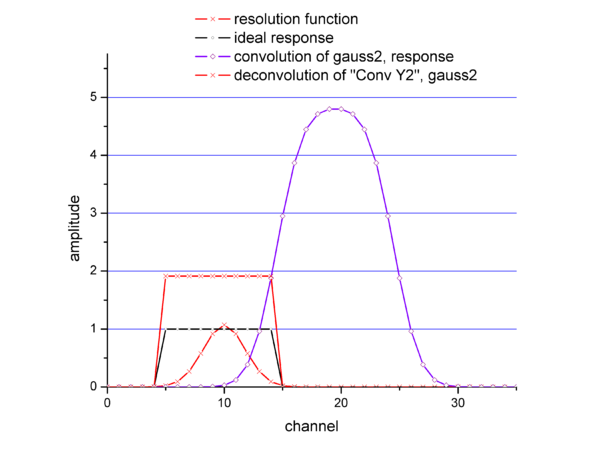
If we take narrower response function we will get
FFT application
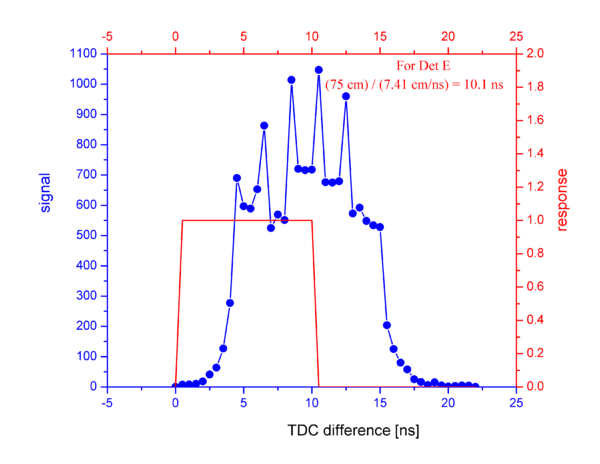
Experimental distribution of TDC difference time spectrum (blue) and ideal response function (red) are shown below:
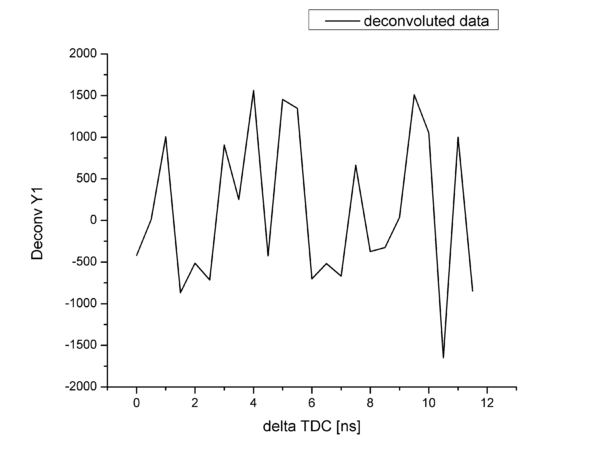
Raw data of FFT deconvolution of signal function and response function is presented below:
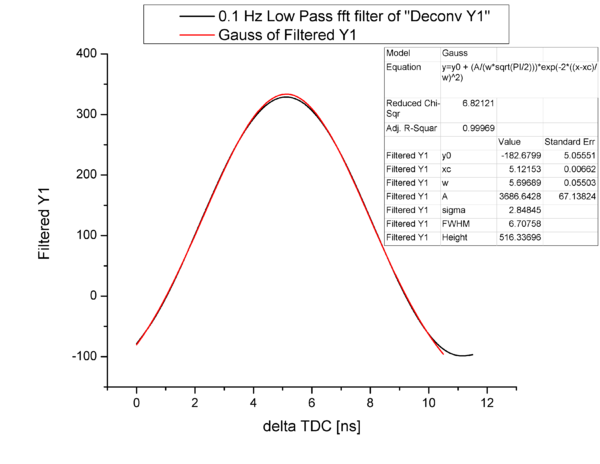
It can be seen the high frequency noise component in the raw data. Applying low pass filtering we could get the deconvoluted data:
Hence, any coordinate of the neutron hit has the following uncertainty in: sigma = 2.8 ns and its value converted into cm is 2.8 ns x 7.41 cm/ns = 20.7 cm. The total length of the active area of the neutron detector is 75 cm.
