Difference between revisions of "Normalized and BKG subtracted data"
Jump to navigation
Jump to search
(Created page with 'For all the timing spectra it was calculated K1(left)-K2(right). 400 px') |
|||
| (19 intermediate revisions by the same user not shown) | |||
| Line 1: | Line 1: | ||
For all the timing spectra it was calculated K1(left)-K2(right). | For all the timing spectra it was calculated K1(left)-K2(right). | ||
| + | |||
| + | Co-60 was used as a source. 2" thick Pb brick with a hole of a diameter ~5mm was used as a collimator. | ||
| + | |||
| + | ==Source is 15.85 cm away from the left PMT== | ||
[[File:15_85_source_subtr_bkg.png | 400 px]] | [[File:15_85_source_subtr_bkg.png | 400 px]] | ||
| + | |||
| + | ==Source is 26.035 cm away from the left PMT== | ||
| + | [[File:26_035_source_subtr_bkg.png | 400 px]] | ||
| + | |||
| + | ==Source is 36.2 cm away from the left PMT== | ||
| + | [[File:36_2_source_subtr_bkg.png | 400 px]] | ||
| + | |||
| + | ==Source is 46.35 cm away from the left PMT== | ||
| + | [[File:46_35_source_subtr_bkg.png | 400 px]] | ||
| + | |||
| + | ==Source is 56.2 cm away from the left PMT== | ||
| + | [[File:56_2_source_subtr_bkg.png | 400 px]] | ||
| + | |||
| + | ==Source is 66.82 cm away from the left PMT== | ||
| + | [[File:66_82_source_subtr_bkg.png | 400 px]] | ||
| + | |||
| + | ==Source is 76.83 cm away from the left PMT== | ||
| + | [[File:76_83_source_subtr_bkg.png | 400 px]] | ||
| + | |||
| + | ==Source is 87 cm away from the left PMT== | ||
| + | [[File:87_source_subtr_bkg.png | 400 px]] | ||
| + | |||
| + | ==Final calibration curve== | ||
| + | |||
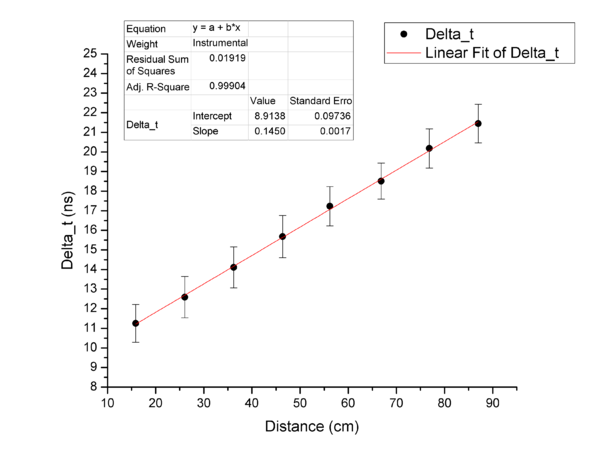
| + | The whole width of a single error bar represents the value of one sigma in time difference spectrum for BKG subtracted data. | ||
| + | |||
| + | [[File:Calibration_curve_corrected.jpg | 600 px]] | ||
| + | |||
| + | Hence, the slope is 0.1450 ns/cm or 6.89 cm/ns. | ||
| + | |||
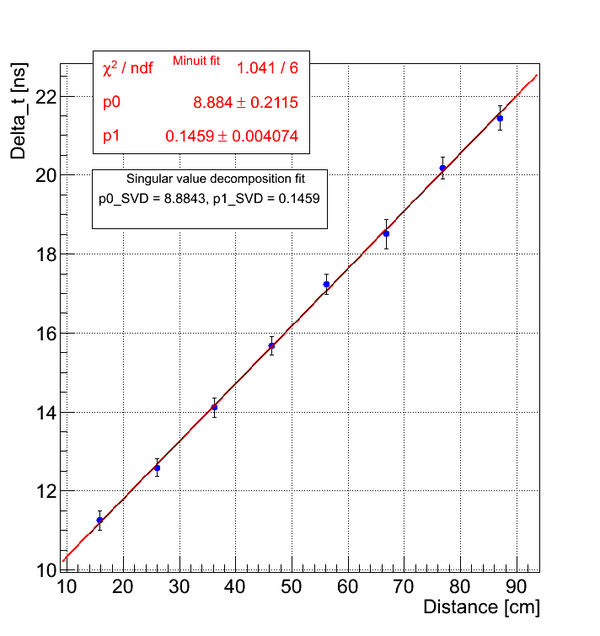
| + | While using ROOT to fit the data, two ways of linear fit were used: Minuit fit and Singular Value Decomposition fit. The whole width of a single error bar in this case represents the value of the error on the mean in fitted time difference spectrum for BKG subtracted data. | ||
| + | |||
| + | [[File:ROOT_curve_fit.png | 600 px]] | ||
| + | |||
| + | The slope is 0.1459 ns/cm or 6.85 cm/ns. | ||
Latest revision as of 15:51, 19 September 2012
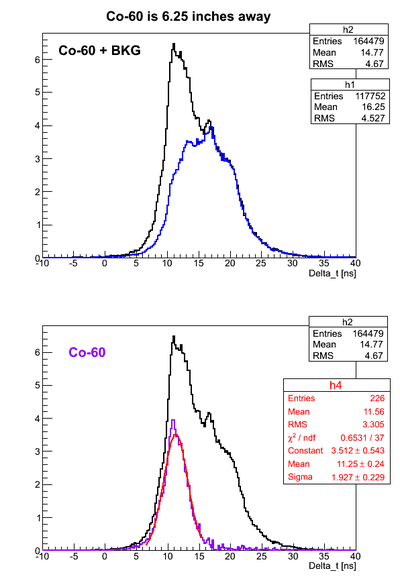
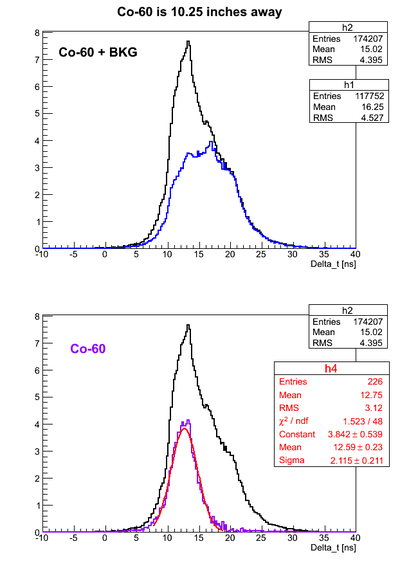
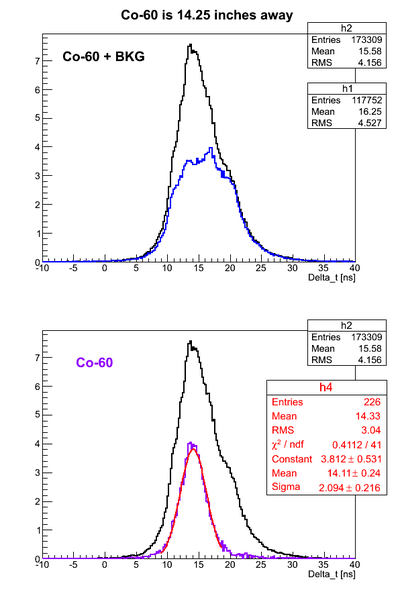
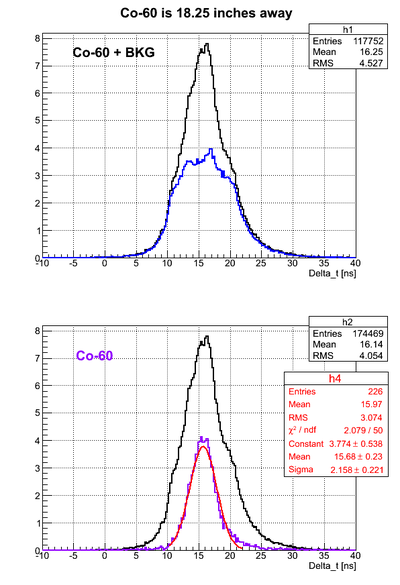
For all the timing spectra it was calculated K1(left)-K2(right).
Co-60 was used as a source. 2" thick Pb brick with a hole of a diameter ~5mm was used as a collimator.
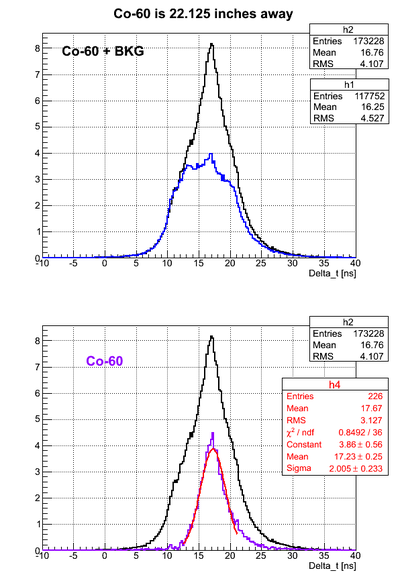
Source is 15.85 cm away from the left PMT
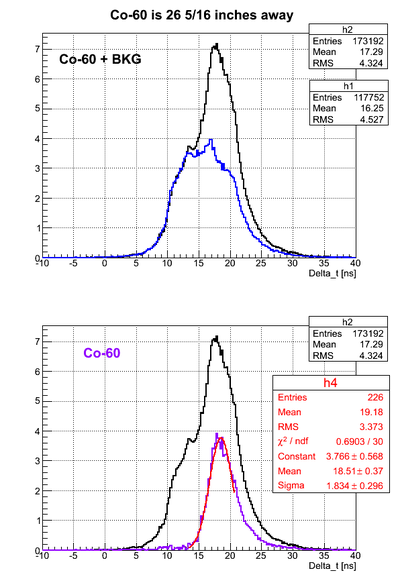
Source is 26.035 cm away from the left PMT
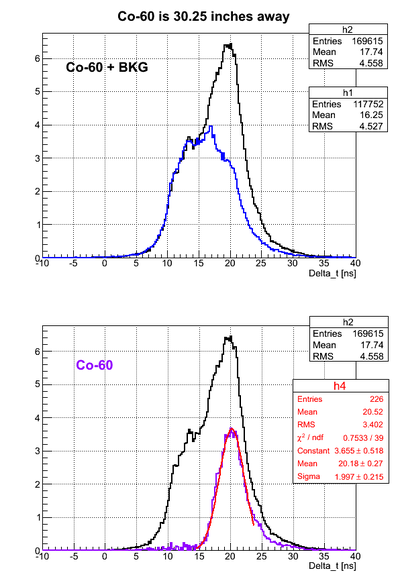
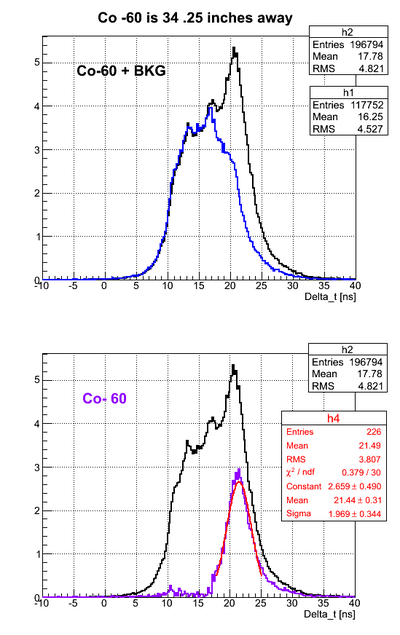
Source is 36.2 cm away from the left PMT
Source is 46.35 cm away from the left PMT
Source is 56.2 cm away from the left PMT
Source is 66.82 cm away from the left PMT
Source is 76.83 cm away from the left PMT
Source is 87 cm away from the left PMT
Final calibration curve
The whole width of a single error bar represents the value of one sigma in time difference spectrum for BKG subtracted data.
Hence, the slope is 0.1450 ns/cm or 6.89 cm/ns.
While using ROOT to fit the data, two ways of linear fit were used: Minuit fit and Singular Value Decomposition fit. The whole width of a single error bar in this case represents the value of the error on the mean in fitted time difference spectrum for BKG subtracted data.
The slope is 0.1459 ns/cm or 6.85 cm/ns.
