Difference between revisions of "Normalized and BKG subtracted data for Det I"
Jump to navigation
Jump to search
| (3 intermediate revisions by the same user not shown) | |||
| Line 10: | Line 10: | ||
[[File:56.2cm_away.png | 400 px]] | [[File:56.2cm_away.png | 400 px]] | ||
| + | |||
| + | |||
| + | ==Source is 76.52 cm away from left== | ||
| + | |||
| + | [[File:76_52cm_away.png | 400 px]] | ||
| + | |||
| + | ==Source is 87 cm away from left== | ||
| + | |||
| + | [[File:87cm_away.png | 400 px]] | ||
| + | |||
| + | ==Calibration curve== | ||
| + | |||
| + | Error bars represent the error on Mean value of fitted Co-60 source signal data. | ||
| + | |||
| + | [[File:Calibration_DetI.png | 400 px]] | ||
| + | |||
| + | So the slope is 0.1826 ns/cm or 5.476 cm/ns | ||
Latest revision as of 16:25, 18 September 2012
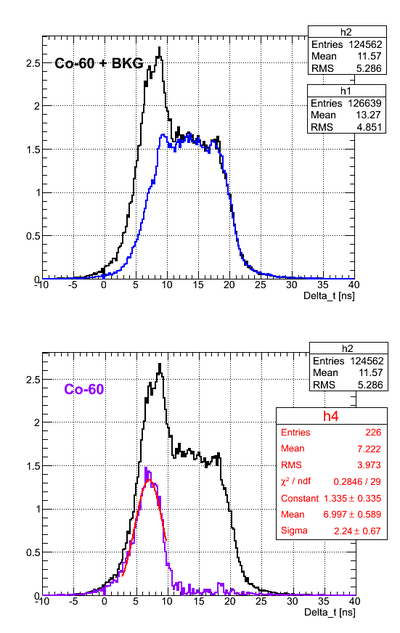
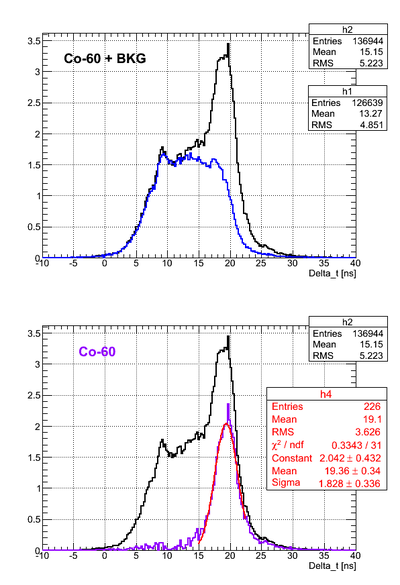
Source is 15.56 cm away from left
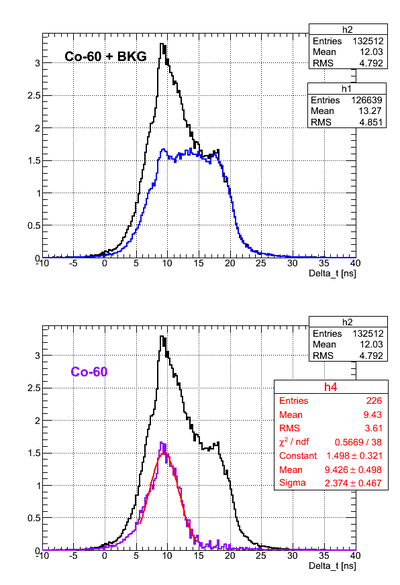
Source is 35.88 cm away from left
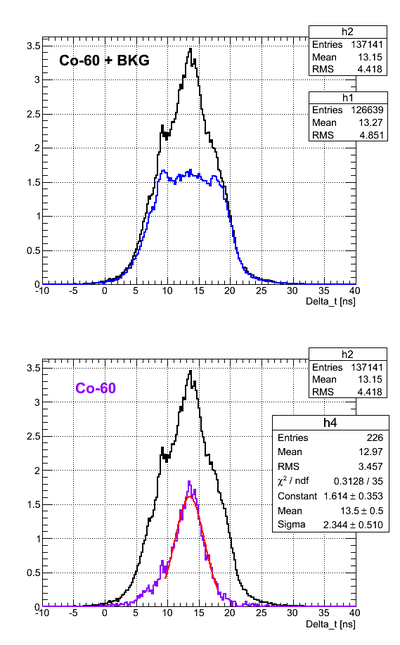
Source is 56.2 cm away from left
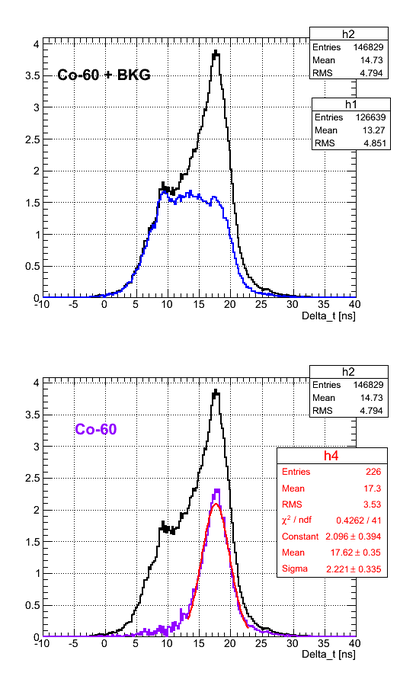
Source is 76.52 cm away from left
Source is 87 cm away from left
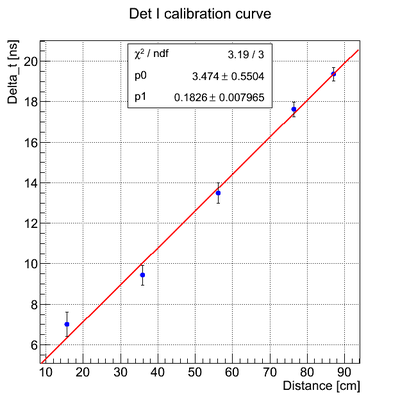
Calibration curve
Error bars represent the error on Mean value of fitted Co-60 source signal data.
So the slope is 0.1826 ns/cm or 5.476 cm/ns
