Difference between revisions of "PePPO 03132012"
Jump to navigation
Jump to search
| Line 123: | Line 123: | ||
T->Draw("CH14:Iteration$","Iteration$<300 & CH14<100","L",10,1) | T->Draw("CH14:Iteration$","Iteration$<300 & CH14<100","L",10,1) | ||
| − | + | [[File:PePPO-03132012-pulses-selection-try-1.png | 400 px]] | |
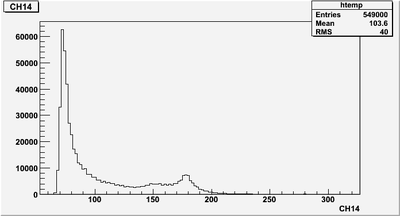
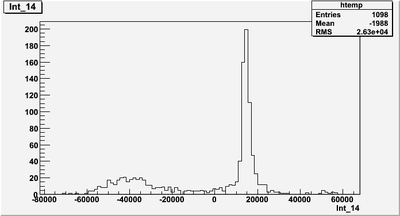
Why CH14 histogram is all positive, but int_14 histogram has negatives? | Why CH14 histogram is all positive, but int_14 histogram has negatives? | ||
Revision as of 17:43, 16 March 2012
Accelerator Configuration
- Accelerator Settings
| beam energy | 6.8 MeV |
| Beam type: | Electron |
| I_average: | 0.3 nA |
| I_peak: | 0.05 A 0.006 duty factor |
| pulse width: | 10 s (it seems on 200 s is possible?) |
| Rate: | 60 Hz |
| PEPPO Spectrometer: | 151.3 A |
Set HV to Detectors
| Signal channel | HV dac | HV (V) | |
| Detectors #1 | A1 | 2.4 | 960 |
| Detectors #2 | A2 | 3.0 | 1200 |
Scope Pictures
CH1: Beam Sync CH2: A1 CH3: A2
| Target | Pictures |
| No Target | 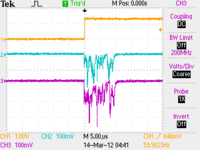 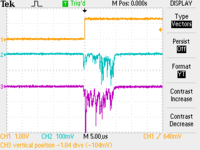
|
| Chromox Target | 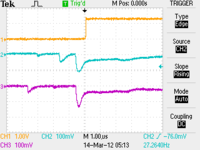 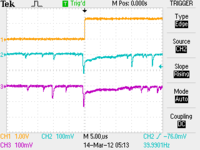
|
Annihilation Counter Runs
- Signal Definitions for Trigger logic
- SYNC:=60 Hz sync pulse 200 micro seconds long
- Det1:= Annihilation Counter #1 (HV1)
- Det2:=Annihilation Counter #2 (HV2)
data analysis
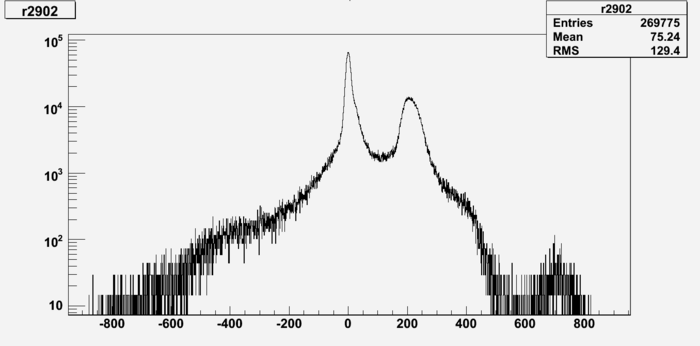
Negative Energy ?
This run 2902, Int_Ch14 histogram. Why there is negative?
Pulses
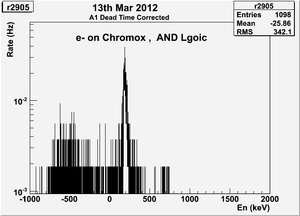
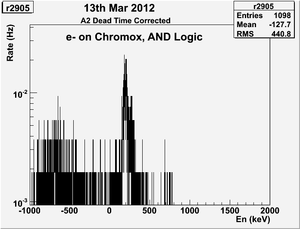
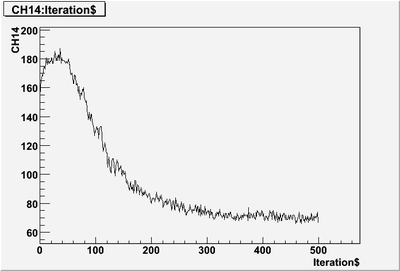
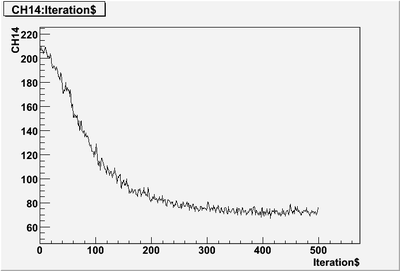
run 2905
1st 100 puleses
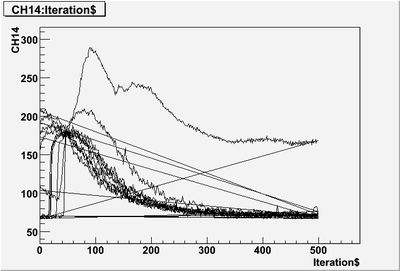
pulse that only partially read-in:
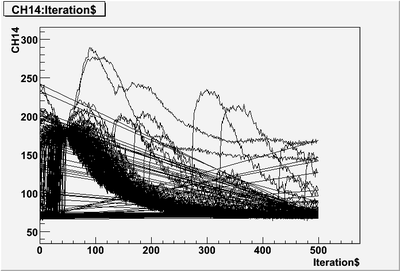
first 10 pulses, some pulses that only partially read-in:
looks like some pulses are only partially read-in. We need to delay signal more?
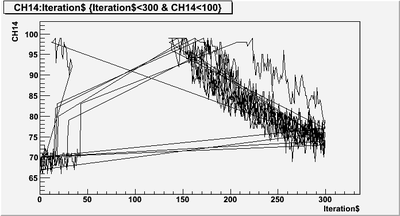
One possible cut may to determine if the signal is increasing within the first 100 - 300 $Iterations. This would be like creating a leading edge discriminator in software.
T->Draw("CH14:Iteration$","Iteration$<300 & CH14<100","L",10,1)
Why CH14 histogram is all positive, but int_14 histogram has negatives?
