Difference between revisions of "Qweak Delta"
| Line 502: | Line 502: | ||
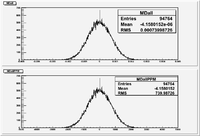
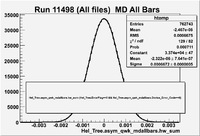
[[File:TChainAsymMDallBars_11948_01.png| 200 px]] | [[File:TChainAsymMDallBars_11948_01.png| 200 px]] | ||
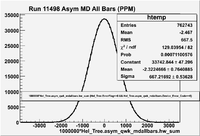
| − | The middle spike near zero appears when there is a device error you | + | The middle spike near zero appears when there is a device error. The spike goes away when you cut on device error==0. |
[[File:TChainAsymMDallBars_11948_wCuts.png| 200 px]] | [[File:TChainAsymMDallBars_11948_wCuts.png| 200 px]] | ||
[[File:TChainAsymMDallBarsPPM_11948_wCuts.png| 200 px]] | [[File:TChainAsymMDallBarsPPM_11948_wCuts.png| 200 px]] | ||
Revision as of 18:45, 25 July 2011
Expected results
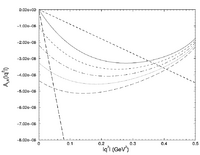
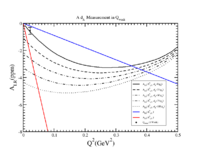
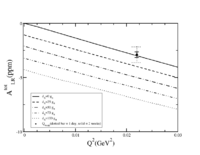
The above Figure in EPS format :File:D Delta Qweak Error.eps
File:A d-delta-vs-Q2.xmgrace.txt
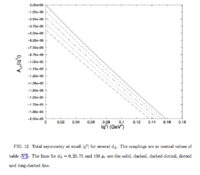
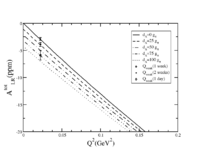
The above Figure in EPS format :File:Atot d Delta Qweak Error.eps
File:Atot d-delta-vs-Q2.xmgrace.txt
Media:PCS_Report_4_LOI-03-105.pdf
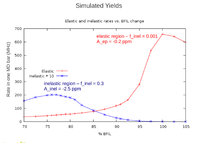
Elastic/Inelastic region Rates
Ratio of Elastic to Inelastic Region Rates = = 9.3:1 = Rate ratio for QTOR=100% / 75%
In the denominator 20 MHz = Inelastic rate and 50 MHz is the elastic rate; according to the simulation
| Qtor | Rate (MHz) |
| 9367 | 590 |
| 9144 | 633 |
| 8921 | 650 |
| 8698 | 528 |
| 8475 | 278 |
| 8252 | 163 |
| 8109 | 131 |
| 8029 | 121 |
| 7806 | 97 |
| 7583 | 84 |
| 7360 | 78 |
| 7226 | 76 |
| 7137 | 74 |
| 7048 | 74 |
| 6958 | 72 |
| 6869 | 69 |
| 6780 | 67 |
| 6691 | 64 |
| 6468 | 58 |
| 6245 | 52 |
Using the root command below
Mps_Tree->Draw("2*qwk_md3pos.hw_sum_raw/(qwk_bcm1.hw_sum+qwk_bcm2.hw_sum)","ErrorFlag==0")
I saw
Yield of MD3 Pos in Run 9905 = 1.644E4 MD counts/BPM counts
Yield of MD3 Pos in Run 9912 = 1.143E5 MD counts/BPM counts
Giving a ratio of 6.95
If I add both bar ends
Mps_Tree->Draw("2*(qwk_md3pos.hw_sum_raw+qwk_md3neg.hw_sum_raw)/(qwk_bcm1.hw_sum+qwk_bcm2.hw_sum)","ErrorFlag==0")
I saw
Yield of MD3 in Run 9905 = 4.179E4 MD counts/BPM counts
Yield of MD3 in Run 9912 = 3.239E5 MD counts/BPM counts
Giving a ratio of 7.75
using
Mps_Tree->Draw("qwk_mdallbars.hw_sum","ErrorFlag==0")
Yield of All Bars in Run 9905 = 0.027 MD counts/BPM counts
Yield of All Bars in Run 9912 = 0.0030 MD counts/BPM counts
ratio = 8.9
There seems to be some error in the comparison.
using the Hel tree
Hel_Tree->Draw("yield_qwk_mdallbars.hw_sum","ErrorFlag==0")
Shows same results as MPS tree mdallbars tree
Elastic Aluminum Asymmetry
The Aluminum asymmetry was measured to be PPM
0.2 MHz/nA using warm gas target
Warm gas contribution about same size as downstream aluminum window.
To do aluminum measurement we can't use warm gas cell.
Aluminum window dilution 0.022+/- 0.002
Transverse Aluminum in Elastic
A sin wave with amplitude of about 4 PPM
You can weight the yields so the transverse asymmetry gets averaged over all octants.
File:Shi-Lin Zhu hep-ph-0107076 2001.pdf
FOM
| Qtor | Meas. Rate (MHz) | Elastic Simulation | Inelastic Simulation |
| 9367 | 590 | ||
| 9144 | 633 | ||
| 8921 | 650 | ||
| 8698 | 528 | ||
| 8475 | 278 | ||
| 8252 | 163 | ||
| 8109 | 131 | ||
| 8029 | 121 | ||
| 7806 | 97 | ||
| 7583 | 84 | ||
| 7360 | 78 | ||
| 7226 | 76 | ||
| 7137 | 74 | ||
| 7048 | 74 | ||
| 6958 | 72 | ||
| 6869 | 69 | ||
| 6780 | 67 | ||
| 6691 | 64 | ||
| 6468 | 58 | ||
| 6245 | 52 |
first Inelastic Data
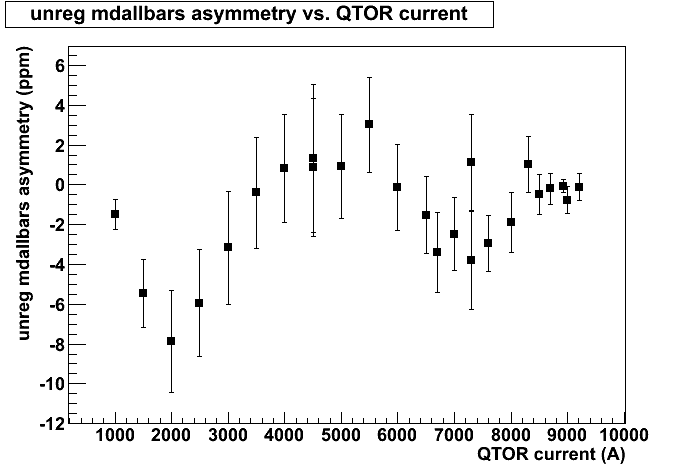
Asym -vs- QTOR
From Logbook entry https://qweak.jlab.org/elog/Analysis+%26+Simulation/254
The inelastic region of interest is expected to line up o the quartz bars when QTOR ~ 0.85 of its value for elastics.
In Feb 2011, QTOR(elastic) = 8921.
=> QTOR(Delta) = 0.85 \times 8921 = 7582
Other runs
These runs were taken 16/Mar/2011 at the tail end of the Dilution factor program. The runs of interest are:
Pedestal runs: 10797, 10799, 10802 QTOR scan runs: 10798 (8921, 8943, 8988, 9200, 9010, 9032, 9054, 9200, 8921)
               10800 (1500-6500 in +500 increments, 6700, 7000, 7300, 7600, 8000)
               10801 (8029, 8188, 8207, 8300, 8386, 8475, 8500, 8564, 8653, 8700, 8743, 8832, 8899, 8921)
Run 9908
1 hour run with HWP OUT
https://hallcweb.jlab.org/hclog/1102_archive/110211010249.html https://hallcweb.jlab.org/hclog/1102_archive/110211020513.html
Run 9905
1 hour run with HWP IN
https://hallcweb.jlab.org/hclog/1102_archive/110210233842.html https://hallcweb.jlab.org/hclog/1102_archive/110211002416.html
Combining 2 hour of data taking
QTOR= 6700 Amps
I_{beam} = 145 \mu A
= Asymmetry averaged over all Main Detectors
If I assume only having 50 \mu A then I would need to take 6 hours of data to get the same statistic as above.
If I take a week of data at 50 \muA then that would correspond to 28 runs like the above.
So the uncertainty would be reduced by The measurement would have an uncertainty of 0.579/sqrt{28} = 0.1 PPM
Qtor scans
Data taken on 4/12/11 check for run numbers
N->Delta Runlist
| Slug / IHWP flip |
Runs | Dates | Run Summaries | Notes | Slug Plots |
|---|---|---|---|---|---|
| 500004 / IN R | 11505-11513 | Apr. 20, 2011 | Runlet plots | Qtor = 6700 | Slug plots |
| 500003 / OUT R | 11496-11502,11504 | Apr. 20, 2011 | Runlet plots | Qtor = 6700 | Slug plots |
| 500002 / OUT L | 9908 | Feb. 11, 2011 | Runlet plots | Qtor=6700 | |
| 500001 / IN L | 9903,9905,9906 | Feb. 11, 2011 | Runlet plots | Qtor=6700 |
- flip
- The R and L refer to the setting of the solenoid in the double Wien injector spin flipper. The first Wien orients the polarization vertically, the solenoid rotates it 90 degrees to the left or right, and then the second Wien orients in horizontally by 90 degrees so it ends up either in a positive or negative helicity state. So this is our second slow helicity flip (in addition to the IHWP IN/OUT).
- IHWP
- This is an insertable half wave plate which changes the circular polarization of the incident laser light used to ejects electrons off the photocathode.
- IHWP(IN) Flip(R) = IHWP(OUT) Flip(L)
Slug list
https://qweak.jlab.org/wiki/index.php/N_to_Delta_Slugs
On Wednesday 4/20/11 Qweak measured the Inelastic N->Delta asymmetry using 160 uA
Run 11498 Summary Table 11498 Run 11498 -
Inelastic MD allbars Asym
| HWP | Solenoid | Run | Hw_sum |
| IN | R | 11512 | |
| Out | R | 11498 | |
| IN | L | 9905 | |
| Out | L | 9908 |
background
Dave Mack's technical note on Qweak Background contributions and propogating their error. File:Qweak Doc 965 v1.pdf
Carbon
Run 10678: Dilution tests: 0.5% Carbon, TS trig, QTOR=6700 (score: 18)
Run 10677: Dilution tests: 0.5% Carbon, TS trig, QTOR=8921
Aluminum
10751-10769
Run 10885: DS 4% AL Date: Fri, 18 Mar 2011 13:04:55 -0500
Run 10821: DS Al 4% 30uA Date: Thu, 17 Mar 2011 08:39:43 -0500
Run 10769: DS 4% Al production Date: Wed, 16 Mar 2011 07:29:58 -0500
Run 10768: DS 4% Al production Date: Wed, 16 Mar 2011 06:21:17 -0500
Run 10767: DS 4% Al production Date: Wed, 16 Mar 2011 05:50:22 -0500
Run 10766: DS 4% Al production Date: Wed, 16 Mar 2011 04:47:55 -0500
10731-10739
Run 10739: Parity 4% DS Al, 25uA, QTOR=8921 A, 3.5x3.5 mm, HWP= IN. Date: Tue, 15 Mar 2011 07:37:22 -0500
11335 -- 6700A 4% Al HWP IN
11333 -- 6700A 4% Al HWP OUT
11331 -- 2000A 4% Al HWP OUT
11330 -- SCAN 4% Al HWP OUT
Qtor scan
10478-10495 Run 10495: 4% DS dummy coarse QTOR scan run @ 45 nA,QTOR @ 8921 A Date: Sat, 12 Mar 2011 09:29:29 -0500
QTor scan using Aluminum target
5/4/2011 - 5/5/2011 (Night shift)
Regression
https://qweak.jlab.org/wiki/index.php/Q-weak_Regression_Wiki_Page
Data Analysis
getting Qweak data from the Silo
jcache -g hallc /mss/hallc/qweak/rootfiles/pass0/*run number here*
looking for GOOD runs in database
There is a GUI interface on cdaql4 which can be run to look at run numbers and see their quality as recorded in the data base.
On cdaql4 run
./good_for_GUI
Root file format
The Qweak root files contain 2 trees ( MPS_Tree and EL_Tree). As the names suggest, the MPS tree contains data from devices for each Helicity bin. The HLS tree constructs helicity differences and asymmetries for each device in the data stream.
The devices listed in each tree above are folders which have sorted the data into 4 time windows within the helicity gate.
In the MPS_Tree there is a Bock0, Block1, Block2, Block3 which measures devices at 4 intervals within the helicity pulse, Block0 is first.
Several devices in the MPS_Tree are actually folders which contain branches that are raw readout, processed readout (value is converted to a unit via a calibration constant).
Drawing tree elements
Mps_Tree->Draw("qwk_bcm1.hw_sum","ErrorFlag==0")
If you get an error try
.ls
or try going up to the file subdirectory
if you pass the filename on the command line then the file is opened under the name file(0) so
_file0->cd()
should take you to the main subdirectory.
I think using the old TBrowser(0 screws up the pointers. "cd" to the file pointer when that happens.
Creating Analysis Framework with MakeClass
Get a listing of available trees/ntuples
root [9] .ls
TFile**         QwPass1_9905.000.root   QWeak ROOT file
 TFile*         QwPass1_9905.000.root   QWeak ROOT file
  OBJ: TTree    Hel_Tree        Helicity event data tree : 0 at: 0x96ce3a0
  KEY: TList    9905.000_condition;1    object title
  KEY: TDirectoryFile   mps_histo;1     mps_histo
  KEY: TDirectoryFile   hel_histo;1     hel_histo
  KEY: TTree    Mps_Tree;1      MPS event data tree
  KEY: TTree    Hel_Tree;1      Helicity event data tree
  KEY: TTree    Slow_Tree;1     EPICS and slow control tree
Create a class to analyze the Hel_Tree
root [10] Hel_Tree->MakeClass()
Info in <TTreePlayer::MakeClass>: Files: Hel_Tree.h and Hel_Tree.C generated from TTree: Hel_Tree
(Int_t)(0)
Comparing Tree to created histos
I created an analysis framework using MakeClass and pass 1 root file QwPass1_9905.000.root
Below I compare the tree entries in
Hel_Tree->asym_qwk_mdallbars_hw_sum
to filing a histogram using the analysis framework
MDall->Fill(asym_qwk_mdallbars_hw_sum);
They are identical
Now compare the histogram when you multiply the entries by 1000000.
The are identical.
So I have some faith in my analysis program to create histograms in units of PPM
Chaining
Now lets chain several files together from within the Analysis framework generated by MakeClass
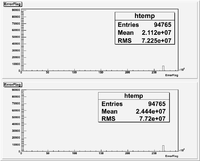
In file QwPass1_11498.000.root I see 94,765 events in the Hel_Tree.ErrorFlag Tree
In file QwPass1_11498.001.root I see 94,765 events in the Hel_Tree.ErrorFlag Tree (The mean is different because they are two different time parts of the same run)
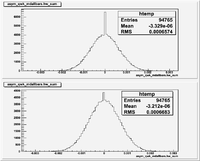
Doing the same for Hell_Tree.asym_qwk_mdallbars.hw_sum Is see the same number of events and different means
Now I chain the files using
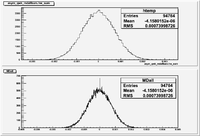
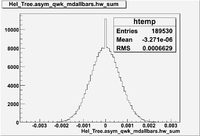
and I see the expected 189530 events. The MDallBars asymmetry looks like
The middle spike near zero appears when there is a device error. The spike goes away when you cut on device error==0.
