Difference between revisions of "OptiM32 HRRL PositronDesign"
| Line 53: | Line 53: | ||
[[File:Optim_QS_Step3.png | 200 px]] | [[File:Optim_QS_Step3.png | 200 px]] | ||
| + | |||
| + | The above says the quadrupole B-field step size is set to 0.005. | ||
Revision as of 01:11, 19 November 2009
Software
Optim32 beamline design software
http://www-bdnew.fnal.gov/pbar/organizationalchart/lebedev/OptiM/optim.htm
G4Beamline
http://www.muonsinc.com/tiki-index.php?page=G4beamline
Quick Start
The instruction below assume you have successfully installed the software above.
Creat the *.in files
On the windows machine you can open the file below which represent one design for the HRRL positron source
File:Optim32 HRRL Design Script V1.0.txt
save the above file as HRRL.opt.
The launch the Optim executable by double clicking.
After it is launched click on the "file" menu in the GUI and select the "Open" menu item to choose the file HRRL.opt.
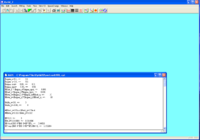
After it is loaded you should see the following below.
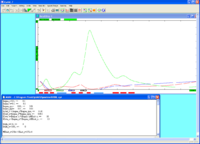
If you click on the icon with the symbols (9th button from the end of the tool bar) you can get a plot of the beam dispersion
This is an interactive display. You can adjust values in the loaded text vile and watch their effect on the dispersion. Notice the colored rectangles at the colored rectangles at the bottom of the beta curve sub window. Starting from the left bottom there are 3 read rectangles , a blue rectangle, then 3 red rectangles, a blue rectangle, and finally 3 more red rectangles. The red rectangles are the quadrupoles in the beam line and the blue rectangles are the dipoles. If you click on them their element name will appear in the upper right corner of the dispersion sub window.
If you scroll down the HRRL.opt input file to line which says
begin list
you will se a list of all the elements, the B-field values, their lengths, etc...
If you scroll down to the first quad
q0 L[cm]=13 G[kG/cm]=0.0438324 Tilt[deg]=0
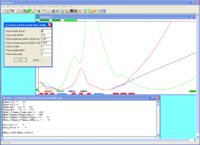
you can move the curser the the B-field value "G[kG/cm]=0.0438324" and increment it while watch the effect on the dispersion plot. You increments it hitting the left and right arrow keys while holding down the "Crtl" key. The value of the increment step is controlled by through the parameters available in the dialog box you get when you select "Steps" from the "Edit" menu.
The above says the quadrupole B-field step size is set to 0.005.


