Difference between revisions of "HRRL 4-13-09"
| (93 intermediate revisions by the same user not shown) | |||
| Line 109: | Line 109: | ||
It looks like the rate is not changing much in region of the DC Sense HV ~1250-1500 Volts. Below 1200 Volts of DC Sense i was not getting any events. So i decided to stop At 1200 Volts and not go below that. | It looks like the rate is not changing much in region of the DC Sense HV ~1250-1500 Volts. Below 1200 Volts of DC Sense i was not getting any events. So i decided to stop At 1200 Volts and not go below that. | ||
| − | <math>Rate % | + | <math>Rate % \equiv \left ( \left [\frac{\mbox{Counts(DCSenseWire4 + Front Scint + RF)}}{\mbox{RF Pulses}} \right ]_{\mbox{BrickOut}} - \left [\frac{\mbox{Counts(DCSenseWire4 + Front Scint + RF)}}{\mbox{RF pulses}}\right ]_{\mbox{BrickIn}}\right ) \times 100 %</math> |
| + | |||
| + | |||
;Data Table | ;Data Table | ||
{| border="3" cellpadding="20" cellspacing="0" | {| border="3" cellpadding="20" cellspacing="0" | ||
| − | |DC Sense HV (Volts)|| Rate % (BrickOut-BrickIn) || | + | |DC Sense HV (Volts)|| Rate % (BrickOut-BrickIn) || Rate % (Brick Out) || Rate % (Brick In) |
|- | |- | ||
| − | | 1200 || 0.11 || 0. | + | | 1200 || 0.11 <math>\pm</math> 0.008 || 0.2 <math>\pm</math> 0.09 || 0.09 <math>\pm</math> 0.1 |
|- | |- | ||
| − | | 1300 || 2.07 || 0. | + | | 1300 || 2.07 <math>\pm</math> 0.18 || 2.29 <math>\pm</math> 0.29 || 0.21 <math>\pm</math> 0.12 |
|- | |- | ||
| − | | 1400 || 9.25 || 1. | + | | 1400 || 9.25 <math>\pm</math> 1.35 || 10.73 <math>\pm</math> 1.97 || 0.3 <math>\pm</math> 0.08 |
|- | |- | ||
| − | | 1500 || 11.3 || | + | | 1500 || 11.3 <math>\pm</math> 3.4 || 12.6 <math>\pm</math> 4.4 || 1.3 <math>\pm</math> 1 |
|- | |- | ||
| − | | 1550 || 32.57 || 0. | + | | 1550 || 32.57 <math>\pm</math> 0.46 || 37.17 <math>\pm</math> 0.62 || 4.6 <math>\pm</math> 0.16 |
|} | |} | ||
| Line 133: | Line 135: | ||
| + | [[Image:PlateauCurveDCMetalica_LogarithmicScale_4-16-09_HRRL_BrickInOutBrickIn-Out.jpg|450px]] | ||
;Plateau Curve [[Image:Forest_IoniztionChamberOperatingRegions.jpg|300px]] | ;Plateau Curve [[Image:Forest_IoniztionChamberOperatingRegions.jpg|300px]] | ||
| + | ODU Efficiency curve. HV = Sense - Field | ||
| + | |||
| + | [[Image:ODU_R1eff-vs-HV.png|300 px]] | ||
| + | |||
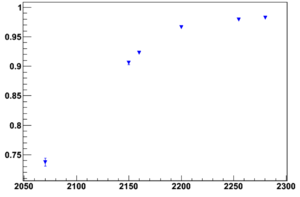
| + | Our baby chamber measurements suggests a plateau near a sense wire HV of 1400 Volts and ODU saw a plateau near a Sense-Field high voltage of 2250 => Sense HV around 1400 volts like ours. | ||
==DC + FSC1 Coinc== | ==DC + FSC1 Coinc== | ||
| Line 291: | Line 299: | ||
| In|| 34700 || 120 || 0.3 % | | In|| 34700 || 120 || 0.3 % | ||
|- | |- | ||
| − | | Out|| 9835 || 1278 || | + | | Out|| 9835 || 1278 || 13 % |
| − | |||
| − | |||
|- | |- | ||
| − | | | + | | In|| 44456 || 102 || 0.2% |
|} | |} | ||
| Line 375: | Line 381: | ||
(from Center) 2" r952 16:06:20 16:06:54 | (from Center) 2" r952 16:06:20 16:06:54 | ||
| − | + | 6" r954 16:09:01 16:09:16 | |
| − | + | [[Image:HRRL_DCPosition_Measurements_4-16-09_UsingADC_ShutterOut.jpg|550px]] | |
| − | The histograms below are weighted by time, y axis | + | The histograms below are weighted by time and background is eliminated, y axis represent number of counts per second. |
| − | [[Image: | + | {| border="3" cellpadding="20" cellspacing="0" |
| + | | Distance from the Endplate of DCSenseWire4 (inches) || Run Number || Number of Events/sec (BrickOut, Integral)|| ADC Histogram (>100 channels) | ||
| + | |- | ||
| + | | 0" || r949 || 219 <math>\pm</math> 0.067 || [[Image:Position_Measurements_For_DCMetallica_SenseWire4_1450Volts_949.gif|150px]] | ||
| + | |- | ||
| + | | 1.5" || r954 || 257 <math>\pm</math> 0.062 || [[Image:Position_Measurements_For_DCMetallica_SenseWire4_1450Volts_954.gif|150px]] | ||
| + | |- | ||
| + | | 5.5" || r952 || 388 <math>\pm</math> 0.05 || [[Image:Position_Measurements_For_DCMetallica_SenseWire4_1450Volts_952.gif|150px]] | ||
| + | |- | ||
| + | | 7.5 " || r951 || 221 <math>\pm</math> 0.067 || [[Image:Position_Measurements_For_DCMetallica_SenseWire4_1450Volts_951.gif|150px]] | ||
| + | |- | ||
| + | | background || r950 || 0.36 <math>\pm</math> 1.7 || [[Image:Position_Measurements_For_DCMetallica_SenseWire4_1450Volts_950.gif|150px]] | ||
| + | |} | ||
=4/17/09= | =4/17/09= | ||
| Line 409: | Line 427: | ||
==Trigger setup== | ==Trigger setup== | ||
| − | |||
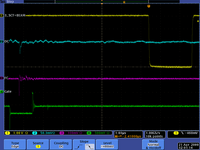
| − | [[Image: | + | As a trigger 3 Scintillators with RF Gate were used. Drift Chamber was sandwiched between the 1cm^2 Small fron PMT and Blue Second scintillator. At the end we had also blue scintillator. Two Blue scintillators were forming cross. |
| + | |||
| + | [[Image:ExperimentalSetup_4-20-09.gif|500px]] | ||
| + | [[Image:Trigger_3Scint_RFgate.png|200px]][[Image:Trigger_3Scint_RFgate_DC.png|200px]] | ||
== Run Range== | == Run Range== | ||
| Line 433: | Line 453: | ||
==Plateau Measurements== | ==Plateau Measurements== | ||
| + | [[Image:HRRL_16-04-09_DCSenseHV_vs_RateShutterInandOut_ADCMeasurements.jpg|450px]][[Image:HRRL_16-04-09_DCSenseHV_vs_RateShutterInandOut_ADCMeasurements_1.jpg|450px]] | ||
| + | |||
{| border="3" cellpadding="20" cellspacing="0" | {| border="3" cellpadding="20" cellspacing="0" | ||
| Line 492: | Line 514: | ||
== Position measurements== | == Position measurements== | ||
| − | ===Scaler Measurements=== | + | ===Scaler and ADC Measurements=== |
| − | + | On y axis of ADC Histograms i have number of events per second. | |
{| border="3" cellpadding="20" cellspacing="0" | {| border="3" cellpadding="20" cellspacing="0" | ||
| − | | Distance from the Endplate of DCSenseWire4 (inches) || Rate % || | + | | Run #|| Brick In/Out|| rep rate (Hz)|| current (ma) || Distance from the Endplate of DCSenseWire4 (inches) || Number RF gates (SCAL13)|| Number Coincidences (SCAL08)|| DC coinc with 3PMT + RF gate (SCAL02)|| Rate SCAL02/SCAL13 (%) || DC_ADC Histograms(ADC15 && ADC8(FC)>1000) || DC_ADC Histograms(ADC15>80 && FC>1000) || Rate% (ADC15>80&&FC>1000) || Rate % (ADC15>80&&FC>1000/ADC15&&ADC8(FC)>1000) |
| + | |- | ||
| + | | 1028 || Out || 900 || 65 || 1" || 3561 || 1462 || 819 || 22 || [[Image:HRRL_16-04-09_DCS4_1450Volts_PosMeas_1028.gif|100px]] || [[Image:HRRL_16-04-09_DCS4_1450Volts_PosMeas_1028_1.gif|100px]] || | ||
| + | |- | ||
| + | | 1029 || Out || 900 || 65 || 2" || 9988 || 4012 || 2480 || 25|| [[Image:HRRL_16-04-09_DCS4_1450Volts_PosMeas_1029.gif|100px]] || [[Image:HRRL_16-04-09_DCS4_1450Volts_PosMeas_1029_1.gif|100px]] || | ||
| + | |- | ||
| + | | 1030 || Out || 900 || 65 || 3" || 4738 || 1943 || 1217 || 25 || [[Image:HRRL_16-04-09_DCS4_1450Volts_PosMeas_1030.gif|100px]] || [[Image:HRRL_16-04-09_DCS4_1450Volts_PosMeas_1030_1.gif|100px]] || | ||
| + | |- | ||
| + | | 1031 || Out || 900 || 65 || 4" || 4683 || 1891 || 1214 || 26|| [[Image:HRRL_16-04-09_DCS4_1450Volts_PosMeas_1031.gif|100px]] || [[Image:HRRL_16-04-09_DCS4_1450Volts_PosMeas_1031_1.gif|100px]] || | ||
| + | |- | ||
| + | | 1032 || Out || 900 || 65 || 6" || 2440 || 1001 || 619 || 26|| [[Image:HRRL_16-04-09_DCS4_1450Volts_PosMeas_1032.gif|100px]] || [[Image:HRRL_16-04-09_DCS4_1450Volts_PosMeas_1032_1.gif|100px]] || | ||
| + | |- | ||
| + | | 1033 || Out || 900 || 65 || 7.5" || 3420 || 1414 || 965 || 28|| [[Image:HRRL_16-04-09_DCS4_1450Volts_PosMeas_1033.gif|100px]] || [[Image:HRRL_16-04-09_DCS4_1450Volts_PosMeas_1033_1.gif|100px]] || | ||
|- | |- | ||
| − | | 1" || | + | | 1041 || Out || 900 || 65 || -2" || 4570 || 1843 || 41 || 0.9|| [[Image:HRRL_16-04-09_DCS4_1450Volts_PosMeas_1041.gif|100px]] || [[Image:HRRL_16-04-09_DCS4_1450Volts_PosMeas_1041_1.gif|100px]] || |
| + | |- | ||
| + | | 1039 || In || 900 || 65 || 1" || 4074 || 1342 || 388 || 10 || [[Image:HRRL_16-04-09_DCS4_1450Volts_PosMeas_1039.gif|100px]] || [[Image:HRRL_16-04-09_DCS4_1450Volts_PosMeas_1039_1.gif|100px]] || | ||
|- | |- | ||
| − | | 2" || | + | | 1038 || In || 900 || 65 || 2" || 5242 || 1681 || 554 || 10 || [[Image:HRRL_16-04-09_DCS4_1450Volts_PosMeas_1038.gif|100px]] || [[Image:HRRL_16-04-09_DCS4_1450Volts_PosMeas_1038_1.gif|100px]] || |
|- | |- | ||
| − | | 3" || | + | | 1037 || In || 900 || 65 || 3" || 2366 || 755 || 261 || 11 || [[Image:HRRL_16-04-09_DCS4_1450Volts_PosMeas_1037.gif|100px]] || [[Image:HRRL_16-04-09_DCS4_1450Volts_PosMeas_1037_1.gif|100px]] || |
|- | |- | ||
| − | | 4" || | + | | 1036 || In || 900 || 65 || 4" || 2437 || 821 || 287 || 12 || [[Image:HRRL_16-04-09_DCS4_1450Volts_PosMeas_1036.gif|100px]] || [[Image:HRRL_16-04-09_DCS4_1450Volts_PosMeas_1036_1.gif|100px]] || |
|- | |- | ||
| − | | 6" || | + | | 1035 || In || 900 || 65 || 6" || 2926 || 904 || 320 || 11 || [[Image:HRRL_16-04-09_DCS4_1450Volts_PosMeas_1035.gif|100px]] || [[Image:HRRL_16-04-09_DCS4_1450Volts_PosMeas_1035_1.gif|100px]] || |
|- | |- | ||
| − | | 7.5 " || 18 || 0. | + | | 1034 || In || 900 || 65 || 7.5" || 3948 || 1247 || 408 || 10 || [[Image:HRRL_16-04-09_DCS4_1450Volts_PosMeas_1034.gif|100px]] || [[Image:HRRL_16-04-09_DCS4_1450Volts_PosMeas_1034_1.gif|100px]] || |
| − | |} | + | |- |
| + | | 1040 || In || 900 || 65 || -2" || 5516 || 1780 || 18 || 0.3 || [[Image:HRRL_16-04-09_DCS4_1450Volts_PosMeas_1040.gif|100px]] || [[Image:HRRL_16-04-09_DCS4_1450Volts_PosMeas_1040_1.gif|100px]] || | ||
| + | |} | ||
| − | + | ====Scaler Results==== | |
| − | |||
| + | <math>Rate = \frac{Coinc(DC+PMT+RFGate)}{RF Gate} \times 100 %</math> | ||
| + | ;Data Summery Table | ||
{| border="3" cellpadding="20" cellspacing="0" | {| border="3" cellpadding="20" cellspacing="0" | ||
| − | + | | Distance from the Endplate of DCSenseWire4 (inches) || Rate % (BrickOut-BrickIn) || Rate % (Brick In) || Rate % (Brick Out) | |
| + | |- | ||
| + | | 1" || 12 <math>\pm</math> 0.53 || 10 <math>\pm</math>0.3 || 22 <math>\pm</math> 0.2 | ||
|- | |- | ||
| − | | | + | | 2" || 12 <math>\pm</math> 0.52 || 10 <math>\pm</math> 0.3 || 25 <math>\pm</math> 0.2 |
|- | |- | ||
| − | | | + | | 3" || 15 <math>\pm</math> 0.5 || 11 <math>\pm</math> 0.3 || 25 <math>\pm</math> 0.2 |
|- | |- | ||
| − | | | + | | 4" || 14 <math>\pm</math> 0.48 || 12 <math>\pm</math> 0.3 || 26 <math>\pm</math> 0.19 |
|- | |- | ||
| − | | | + | | 6" || 15 <math>\pm</math> 0.5 || 11 <math>\pm</math> 0.3 || 26 <math>\pm</math> 0.19 |
|- | |- | ||
| − | | | + | | 7.5 " || 18 <math>\pm</math> 0.51 || 10 <math>\pm</math> 0.3 || 28 <math>\pm</math> 0.19 |
|- | |- | ||
| − | | | + | | -2 || 0.6 <math>\pm</math> 2.88 || 0.9 <math>\pm</math> 1 || 0.3 <math>\pm</math> 1.8 |
| + | |} | ||
| + | |||
| + | [[Image:DCMetalica_Position_vs_Rate_1450Volts_4-20-09.jpg|450px]][[Image:DCMetalica_Position_vs_Rate_1450Volts_4-20-09_ShutterIn_Out_out-In.jpg|450px]] | ||
| + | |||
| + | ====ADC Results==== | ||
| + | |||
| + | ;Example Calculating the mean value of Rate | ||
| + | I chose r1028.root file. The run was broken into three runs. For each run Faraday Cup was made(FC>1000). | ||
| + | |||
| + | [[Image:FC_HRRL_16-04-09_r1028.gif|450px]][[Image:FC_HRRL_16-04-09_r1028_after_cut.gif|450px]] | ||
| + | |||
| + | Run divided into three separate files: | ||
| + | |||
| + | |||
| + | [[Image:ADC_HRRL_16-04-09_r1028_1.gif|350px]][[Image:ADC_HRRL_16-04-09_r1028_2.gif|350px]][[Image:ADC_HRRL_16-04-09_r1028_3.gif|350px]] | ||
| + | |||
| + | <math>Rate % = \frac{ADC Counts (FC>1000 ADC>80)}{ADC Counts(FC>1000)} \times 100 %</math> | ||
| + | |||
| + | THe mean value and error for each file was done using the weighted error propagation [http://www.physics.umd.edu/courses/Phys261/F06/ErrorPropagation.pdf]. | ||
| + | |||
| + | |||
| + | |||
| + | |||
| + | ;Data Summery Table | ||
| + | |||
| + | |||
| + | {| border="3" cellpadding="20" cellspacing="0" | ||
| + | | Distance from the Endplate of DCSenseWire4 (inches) || Rate % (BrickOut-BrickIn) || Rate % (Brick Out) || Rate % (Brick In) | ||
|- | |- | ||
| − | | | + | | 1" || 17 <math>\pm</math> 0.87 || 28 <math>\pm</math>0.4 || 11 <math>\pm</math> 0.47 |
| − | |||
| − | |||
|- | |- | ||
| − | + | | 2" || 21 <math>\pm</math> 1.23 || 35 <math>\pm</math> 0.48 || 14 <math>\pm</math> 0.75 | |
|- | |- | ||
| − | + | | 3" || 20 <math>\pm</math> 1.34 || 36 <math>\pm</math> 0.44 || 16 <math>\pm</math> 0.9 | |
|- | |- | ||
| − | + | | 4" || 21 <math>\pm</math> 1.4 || 38 <math>\pm</math> 0.6 || 17 <math>\pm</math> 0.8 | |
|- | |- | ||
| − | + | | 6" || 22 <math>\pm</math> 1.297 || 39 <math>\pm</math> 0.557 || 17 <math>\pm</math> 0.74 | |
|- | |- | ||
| − | + | | 7.5 " || 22 <math>\pm</math> 1.32 || 39 <math>\pm</math> 0.48 || 17 <math>\pm</math> 0.84 | |
|- | |- | ||
| − | | | + | | -2 || 0.3 <math>\pm</math> 0.97 || 2.7 <math>\pm</math> 0.4 || 2.4 <math>\pm</math> 0.57 |
| − | + | |} | |
| + | |||
| + | [[Image:HRRL_16-04-09_Position_vs_Rate_ADCMeasuremts_AllData_UsingSimpleErrorCalculation.jpg|650px]] | ||
| + | |||
| + | ;Example Calculating Weighted Error | ||
| + | |||
| + | <math>\sigma _{\bar{X}} = \sqrt{\frac{1}{\Sigma _i \sigma_i^{-2}}} = \sqrt{\frac{1}{(\frac{1}{\sqrt{17642}})^{-2} + (\frac{1}{\sqrt{17679}})^{-2} + (\frac{1}{\sqrt{17631}})^{-2}}} = 0.4 %</math> | ||
| + | |||
| + | |||
| + | Puts cuts on ADC data until rate is the same as with scaler data then overlay position measurements plots | ||
| + | |||
| + | ====DC efficiency==== | ||
| + | |||
| + | Plot histogram for all runs to check if pedestal is in same location. | ||
| + | |||
| + | Some ADC runs had 3 scintillators in coincidence. Use this to check DC efficiency. plot as function of HV the ratio of DC hits to coincidences. use the ADC value for the wire output to do several different signal thresholds. | ||
| + | |||
| + | |||
[http://wiki.iac.isu.edu/index.php/Qweak Go Back] [[Qweak]] | [http://wiki.iac.isu.edu/index.php/Qweak Go Back] [[Qweak]] | ||
Latest revision as of 22:19, 10 June 2009
Default HRRL running Conditions
| Pulse Width | Rep Rate | Energy | |
| 8 mA | 25 ns | 1 Hz | 3 MeV |
run plan
| Date | Task |
| 4/11/09 | Vaho stil running til 7 pm, configure Motion Sliders |
| 4/12/09 | Build shutter and unstack beam line |
| 4/13/09 | Install Aluminum brick shutter and interlock with HRRL, test beam transport: Run HRRL accelerator from 3pm til 5 pm (25 ns pulse width, 3 MeV electrons, 1 Hz rep rate, 8 mA peak) |
| 4/14/09 | Repair Freon leak in Chiller, HRRL down, Install DAQ |
| 4/15/09 | Run HRRL from 3 pm til 5 pm (25 ns pulse width, 3 MeV electrons, 1 Hz rep rate, 8 mA peak), Do Plateau measurements and test readout |
| 4/16/09 | Run HRRL from 9 am til 5 pm (25 ns pulse width, 3 MeV electrons, 1 Hz rep rate, 8 mA peak), Do Plateau measurements and test readout |
| 4/17/09 | Run HRRL from 2 pm til 5 pm, position studies using Drift chamber and GEM |
| 4/20/09 | Run HRRL from 9 am til 5 pm finish detector tracking studies |
4/13/09
Electron Dose tests
Shutter In
0.1 mrad/hr outside HRRL experimental door.
2.7 mrad/hr in the end of HRRL experimental hallway.
Shutter Out
0.1 mrad/hr in Dr. Forest office.
Sintillator tests
RS1 = 2 aluminum blocks are in front of Long BLue Scintillator plugged into the cable patch panel 223A2
FS2 = Small scintillator is in 223A1
FS1 = Front Long Blue Scintillator plugged into the 223A4 and High Voltage - A3 channel.
| HV SC1 | HV RS1 | Desc. |
| 840 | 840 |
GEM noise
100 ns RF pulse width
GEM in Accelerator room
The insulation was placed between the mylar bag and the BNC conenctor on the HV board. The inside of the mylar bag is conducting. There is a film covering the outside of the mylar bag which prevents conduction test with voltmeter.
GEM in HRRL exp cell
| Bag | Rep Rate | Current | Peak to peak noise |
| Off No ground strap | 990 Hz | 3 V =60 mA | 1 mV on 1 mus scale |
| on + Ground strap + insulation | 990 Hz | 3 V =60 mA | mV on 1 s scale |
The insulation was placed between the mylar bag and the BNC conenctor on the HV board. The inside of the mylar bag is conducting. There is a film covering the outside of the mylar bag which prevents conduction test with voltmeter.
4/16/09
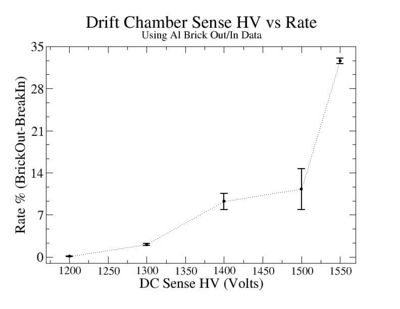
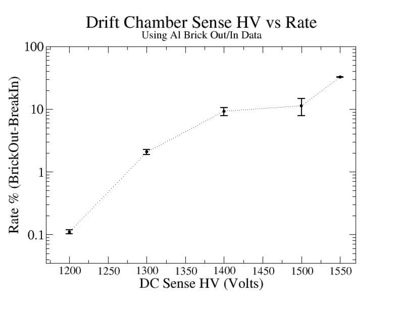
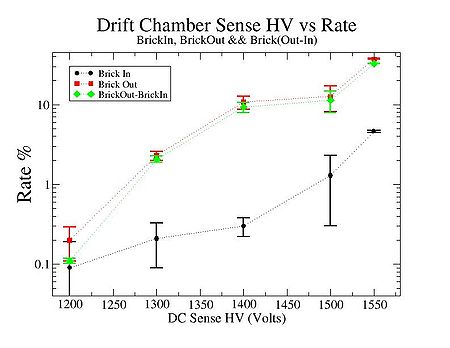
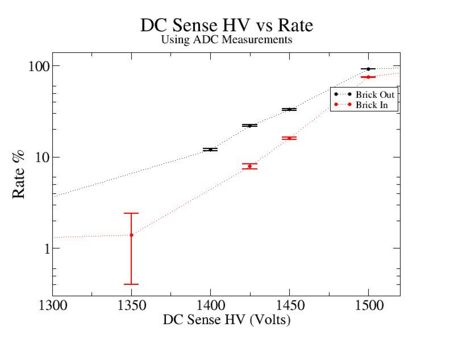
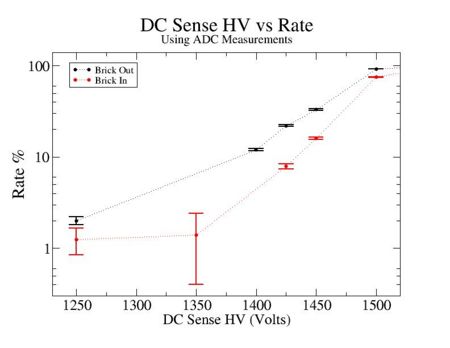
The Plateau Measurements were done using Aluminum Brick. A 2X4X8 Aluminum brick shutter stopped 3 MeV electrons from entering the HRRL experimental cell. The rates seen by the DC and front scintillator were compared when the brick was in vs out. Plateau Curve shown below is based on the data which is represented in this section for each DC Sense High Voltage. The DC Sense HV range was chosen from 1200 Volts to 1550 Volts. For each voltage the data was taken two or three times. It looks like the rate is not changing much in region of the DC Sense HV ~1250-1500 Volts. Below 1200 Volts of DC Sense i was not getting any events. So i decided to stop At 1200 Volts and not go below that.
- Data Table
| DC Sense HV (Volts) | Rate % (BrickOut-BrickIn) | Rate % (Brick Out) | Rate % (Brick In) |
| 1200 | 0.11 0.008 | 0.2 0.09 | 0.09 0.1 |
| 1300 | 2.07 0.18 | 2.29 0.29 | 0.21 0.12 |
| 1400 | 9.25 1.35 | 10.73 1.97 | 0.3 0.08 |
| 1500 | 11.3 3.4 | 12.6 4.4 | 1.3 1 |
| 1550 | 32.57 0.46 | 37.17 0.62 | 4.6 0.16 |
- Our Plateau Curve
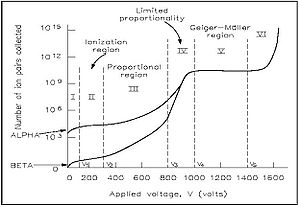
ODU Efficiency curve. HV = Sense - Field
Our baby chamber measurements suggests a plateau near a sense wire HV of 1400 Volts and ODU saw a plateau near a Sense-Field high voltage of 2250 => Sense HV around 1400 volts like ours.
DC + FSC1 Coinc
Accelerator Rep rate is 100 Hz
| Brick | Gun Pulses | DC pulses | DC/Gun pulses |
| Out | 16990 | 1568 | 9.2 % |
| In | 54801 | 310 | 0.6% |
| Out | 10242 | 841 | 8.2% |
| In | 17945 | 93 | 0.5 % |
| Out | 20871 | 1791 | 8.6% |
| In | 15101 | 71 | 0.47 % |
| Out | 6549 | 531 | 8.1% |
It looks like we have electrons firing the DC 10% of the time and photons less than 1% of the time.
HV Settings S:F:G=1800:-900:1260
Accelerator Rep rate is 900 Hz
| Brick | Gun Pulses | DC pulses | DC/Gun pulses |
| Out | 1820 | 285 | 15.6 % |
| In | 6048 | 161 | 2.7 % |
| Out | 1420 | 219 | 15.4% |
| In | 3230 | 110 | 3.4 % |
HV Settings S:F:G=1750:-875:1225
Accelerator Rep rate is 900 Hz
| Brick | Gun Pulses | DC pulses | DC/Gun pulses |
| Out | 2022 | 213 | 10.5% |
| In | 37277 | 308 | 0.8 % |
| Out | 1502 | 178 | % |
| In | 12152 | 112 | % |
| Out | 2325 | 287 | % |
| In | 35474 | 368 | % |
HV Settings S:F:G=1700:-850:1190
Accelerator Rep rate is 900 Hz
| Brick | Gun Pulses | DC pulses | DC/Gun pulses |
| Out | 2358 | 428 | 18 % |
| In | 6576 | 123 | 1.9 % |
| Out | 3115 | 531 | 17 % |
| In | 86819 | 1278 | 1.5 % |
HV Settings S:F:G=1650:-825:1155
Accelerator Rep rate is 900 Hz
| Brick | Gun Pulses | DC pulses | DC/Gun pulses |
| Out | 2690 | 679 | 25 % |
| In | 3560 | 119 | 3.3 % |
HV Settings S:F:G=1600:-800:1120
Accelerator Rep rate is 900 Hz
| Brick | Gun Pulses | DC pulses | DC/Gun pulses |
| Out | 3428 | 1010 | 29 % |
| In | 3904 | 120 | 3% |
HV Settings S:F:G=1550:-775:1085
Accelerator Rep rate is 900 Hz
| Brick | Gun Pulses | DC pulses | DC/Gun pulses |
| Out | 2690 | 982 | 36.5 % |
| In | 2352 | 105 | 4.4 % |
| Out | 645 | 240 | 37% |
| In | 61988 | 2878 | 4.6 % |
| Out | 2391 | 927 | 38% |
| In | 2872 | 139 | 4.8% |
HV Settings S:F:G=1500:-750:1050
Accelerator Rep rate is 900 Hz
| Brick | Gun Pulses | DC pulses | DC/Gun pulses |
| Out | 8021 | 1442 | 17 % |
| In | 37506 | 884 | 2.3 % |
| Out | 5428 | 1431 | 8.2% |
| In | 4496 | 116 | 0.3 % |
HV Settings S:F:G=1400:-700:980
Accelerator Rep rate is 900 Hz
| Brick | Gun Pulses | DC pulses | DC/Gun pulses |
| Out | 50815 | 5703 | 11 % |
| In | 41621 | 178 | 0.4 % |
| Out | 70392 | 8274 | 8.2% |
| In | 34700 | 120 | 0.3 % |
| Out | 9835 | 1278 | 13 % |
| In | 44456 | 102 | 0.2% |
HV Settings S:F:G=1300:-650:910
Accelerator Rep rate is 900 Hz
| Brick | Gun Pulses | DC pulses | DC/Gun pulses |
| Out | 38108 | 1016 | 2.66 % |
| In | 48996 | 190 | 0.38 % |
| Out | 23693 | 532 | 2.24% |
| In | 71868 | 103 | 0.14 % |
| Out | 86296 | 1693 | 1.96% |
| In | 124099 | 147 | 0.118 % |
HV Settings S:F:G=1200:-600:840
Accelerator Rep rate is 900 Hz
| Brick | Gun Pulses | DC pulses | DC/Gun pulses |
| Out | 63976 | 141 | 0.2 % |
| In | 108886 | 97 | 0.09 % |
ADC Measurements
1300 r936 14:41:51 14:49:18 BreakOut
1400 r937 14:50:40 14:51:14 BreakOut
1500 r938 14:54:30 14:55:44 BOut
1600 r939 14:57:10 14:58:47 Bout
1700 r940 15:00:39 15:04:47 bO
1800 r942 15:12:26 15:15:46 bo
1350 r946 15:25:24 15:26:39
1450 r948 15:31:29 15:32:05
1550 r943 15:17:40 15:19:19
1650 r944 15:20:08 15:21:00
1750 r945 15:21:40 15:22:49
Position Measurement
break Out
HV 1450 Sense Wire
on edge of the drift chamber r949 15:48:06 15:48:50
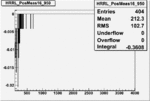
Drift Chamber is removed from the beam r950 15:51:39 15:55:41
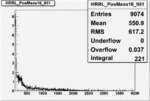
Beam is at the center of DC r951 15:59:45 16:00:12
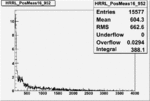
(from Center) 2" r952 16:06:20 16:06:54
6" r954 16:09:01 16:09:16
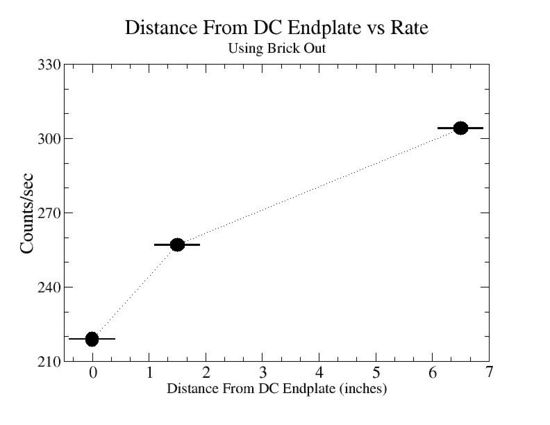
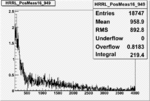
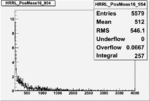
The histograms below are weighted by time and background is eliminated, y axis represent number of counts per second.
4/17/09
Started at 2:25 pm
where are the log book entries for today?
Screen
100 mA no electrons on the screen, the highest current.
At 1850 Volts on sense DC starts sparking on lowest Beam current.
Installing Collimator Current into ADC
Adjusting HRRL Beam Current to Drift Chamber HV
Determine Trigger
Scaler Measurements
4/20/09
Trigger setup
As a trigger 3 Scintillators with RF Gate were used. Drift Chamber was sandwiched between the 1cm^2 Small fron PMT and Blue Second scintillator. At the end we had also blue scintillator. Two Blue scintillators were forming cross.
Run Range
Determine range of operating conditions for DC HV, rep rate and beam current
| Run # | Brick In/Out | rep rate (Hz) | current (ma) | Number RF gates (SCAL13) | Number Coincidences (SCAL08) | DC singles | FC spectrum | DC spectrum | comments |
| 999 | Out | 65 | 40 |  |
|||||
| 1000 | Out | 900 | 40 |  |
100px |
Looks like we should run at 40 mA peak current and change the DC HV from 1200 to 1600 Volts on the sense wire
Plateau Measurements
| Run # | Brick In/Out | rep rate (Hz) | current (ma) | DC HV (S:F:G) | Number RF gates (SCAL13) | Number Coincidences (SCAL08) | DC coinc with 3PMT + RF gate (SCAL02) | Rate SCAL02/SCAL13 (%) | FC spectrum | DC spectrum | DC spectrum(CUT on ADC>80, log scale) Events/sec | comments |
| 1003 | Out | 65 | 40 | 1600:: | 109632 | 217476 | 28709 | 26.2 |  |
100px 100px | Overflows in DC ADC spectrum | |
| 1006 | Out | 900 | 40 | 1600 | 115719 | 212130 | 37534 | 32.4 |  |
 |

| |
| 1007 | Out | 900 | 40 | 1550 | 5781 | 2427 | 1751 | 30.3 |  |
 |
100px | |
| 1008 | Out | 900 | 40 | 1550 | 5803 | 2399 | 1832 | 32 |  |
 |
 |
2dB attenuation added |
| 1009 | Out | 900 | 40 | 1500 | 5650 | 2376 | 1705 | 30.2 |  |
 |
100px | |
| 1010 | Out | 900 | 40 | 1500 |  |
 |
100px | |||||
| 1012 | Out | 900 | 40 | 1500 | 4589 | 1842 | 1385 | 30.2 |  |
 |
 |
5dB attenuation added |
| 1014 | Out | 900 | 40 | 1450 | 6285 | 2609 | 1875 | 30 |  |
 |

| |
| 1015 | Out | 900 | 40 | 1400 | 6089 | 2501 | 1743 | 28.6 |  |
 |

| |
| 1016 | Out | 900 | 40 | 1350 | 9398 | 3799 | 998 | 10.6 |  |
 |

| |
| 1017 | Out | 900 | 40 | 1300 | 6567 | 2681 | 1167 | 17.7 |  |
 |

| |
| 1018 | Out | 900 | 40 | 1250 | 5440 | 2278 | 694 | 12.7 |  |
 |

| |
| 1019 | Out | 900 | 40 | 1200 | 4123 | 1738 | 619 | 15 |  |
 |

| |
| 1020 | out | 900 | 40 | 1150 | 4402 | 1798 | 790 | 17 |  |
 |

| |
| 1021 | out | 900 | 40 | 1425 | 5521 | 2280 | 1812 | 32 |  |
 |

| |
| 1022 | in | 900 | 40 | 1425 | 4681 | 1531 | 825 | 17.6 |  |
 |

| |
| 1023 | in | 900 | 40 | 1600 | 3748 | 1155 | 739 | 19 |  |
 |
100px | |
| 1024 | in | 900 | 40 | 1550 | 6156 | 1899 | 1172 | 19 |  |
 |
100px | |
| 1025 | in | 900 | 40 | 1500 | 6280 | 1920 | 1230 | 19 |  |
 |
100px | |
| 1026 | in | 900 | 40 | 1450 | 3631 | 1142 | 799 | 22 |  |
 |
100px | |
| 1042 | in | 900 | 40 | 1300 | 3616 | 1167 | 424 | 11.7 |  |
 |

| |
| 1043 | in | 900 | 40 | 1350 | 3453 | 1094 | 441 | 13 |  |
 |

| |
| 1044 | in | 900 | 40 | 1250 | 3719 | 1262 | 598 | 16 |  |
 |

| |
| 1045 | in | 900 | 40 | 1200 | 3270 | 1004 | 342 | 10 |  |
 |

| |
| 1046 | in | 900 | 40 | 1150 | 2731 | 911 | 282 | 10 |  |
 |

|
At 1350 Volts HV of Sense wire the count rate seemed like dropped, so i did scaler measurements again twice when the brick was out, and i got the following result: 27 % instead of 10 %. (2867 - 1116 - 776) .
Position measurements
Scaler and ADC Measurements
On y axis of ADC Histograms i have number of events per second.
Scaler Results
- Data Summery Table
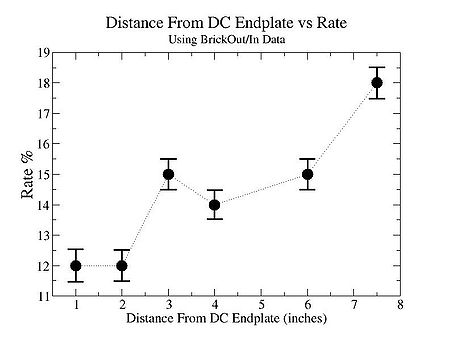
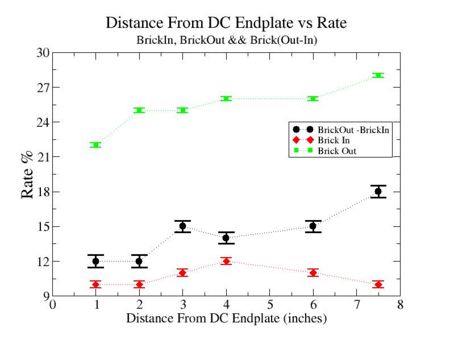
| Distance from the Endplate of DCSenseWire4 (inches) | Rate % (BrickOut-BrickIn) | Rate % (Brick In) | Rate % (Brick Out) |
| 1" | 12 0.53 | 10 0.3 | 22 0.2 |
| 2" | 12 0.52 | 10 0.3 | 25 0.2 |
| 3" | 15 0.5 | 11 0.3 | 25 0.2 |
| 4" | 14 0.48 | 12 0.3 | 26 0.19 |
| 6" | 15 0.5 | 11 0.3 | 26 0.19 |
| 7.5 " | 18 0.51 | 10 0.3 | 28 0.19 |
| -2 | 0.6 2.88 | 0.9 1 | 0.3 1.8 |
ADC Results
- Example Calculating the mean value of Rate
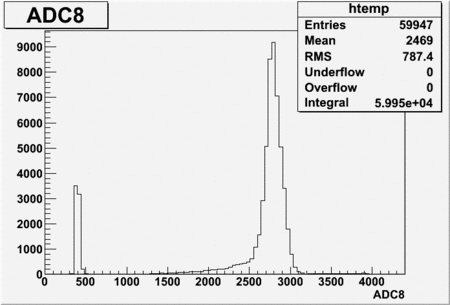
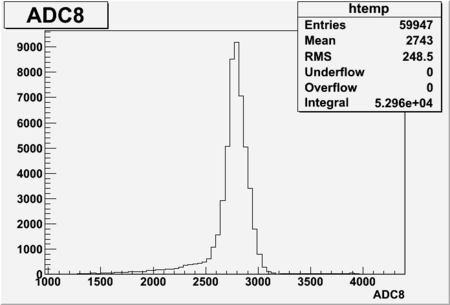
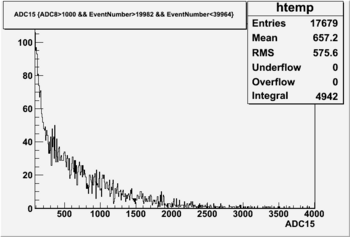
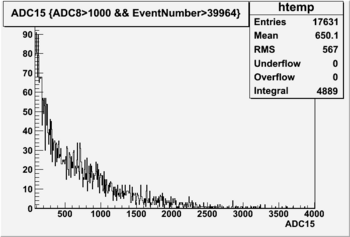
I chose r1028.root file. The run was broken into three runs. For each run Faraday Cup was made(FC>1000).
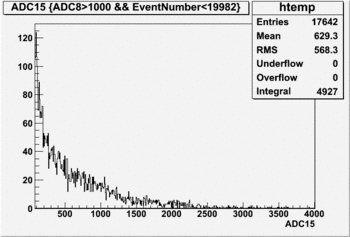
Run divided into three separate files:
THe mean value and error for each file was done using the weighted error propagation [1].
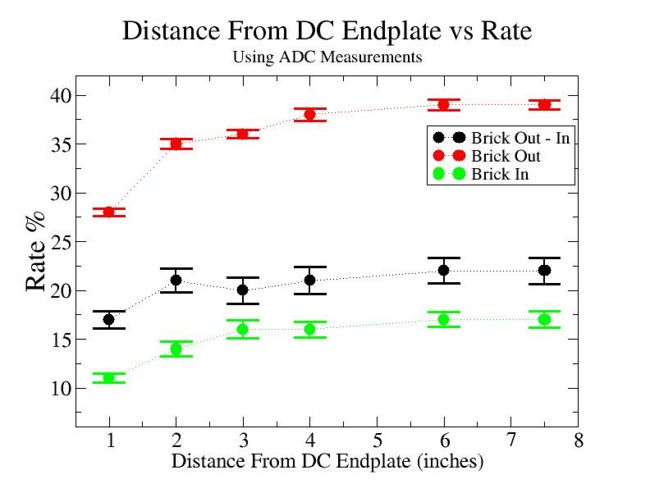
- Data Summery Table
| Distance from the Endplate of DCSenseWire4 (inches) | Rate % (BrickOut-BrickIn) | Rate % (Brick Out) | Rate % (Brick In) |
| 1" | 17 0.87 | 28 0.4 | 11 0.47 |
| 2" | 21 1.23 | 35 0.48 | 14 0.75 |
| 3" | 20 1.34 | 36 0.44 | 16 0.9 |
| 4" | 21 1.4 | 38 0.6 | 17 0.8 |
| 6" | 22 1.297 | 39 0.557 | 17 0.74 |
| 7.5 " | 22 1.32 | 39 0.48 | 17 0.84 |
| -2 | 0.3 0.97 | 2.7 0.4 | 2.4 0.57 |
- Example Calculating Weighted Error
Puts cuts on ADC data until rate is the same as with scaler data then overlay position measurements plots
DC efficiency
Plot histogram for all runs to check if pedestal is in same location.
Some ADC runs had 3 scintillators in coincidence. Use this to check DC efficiency. plot as function of HV the ratio of DC hits to coincidences. use the ADC value for the wire output to do several different signal thresholds.


