Difference between revisions of "A kind of analysis"
Jump to navigation
Jump to search
| Line 1: | Line 1: | ||
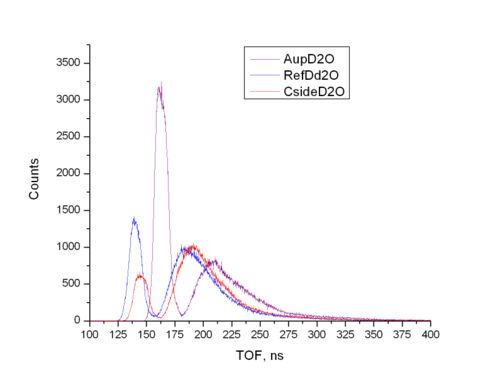
<math>\gamma</math>-peak positions are shifted w.r.t. each other. If we wanna calculate the asymmetry as a function of TOF for each channel (neutron energy) it is necessary to match the positions of centroids of <math>\gamma</math>-peaks. However, one needs to take into account the difference between channel-to-TOF calibration coefficients for each detector. | <math>\gamma</math>-peak positions are shifted w.r.t. each other. If we wanna calculate the asymmetry as a function of TOF for each channel (neutron energy) it is necessary to match the positions of centroids of <math>\gamma</math>-peaks. However, one needs to take into account the difference between channel-to-TOF calibration coefficients for each detector. | ||
| − | This is what we have if we superimpose TOF-spectra within one plot | + | This is what we have if we superimpose TOF-spectra within one plot. It was used used the average channel-to-TOF calibration coe (0.179+0.186+0.19)/3 = 0.185 ns/channel. |
[[Image:asym_0.jpg |500px]] | [[Image:asym_0.jpg |500px]] | ||
Revision as of 17:17, 4 December 2008
-peak positions are shifted w.r.t. each other. If we wanna calculate the asymmetry as a function of TOF for each channel (neutron energy) it is necessary to match the positions of centroids of -peaks. However, one needs to take into account the difference between channel-to-TOF calibration coefficients for each detector.
This is what we have if we superimpose TOF-spectra within one plot. It was used used the average channel-to-TOF calibration coe (0.179+0.186+0.19)/3 = 0.185 ns/channel.
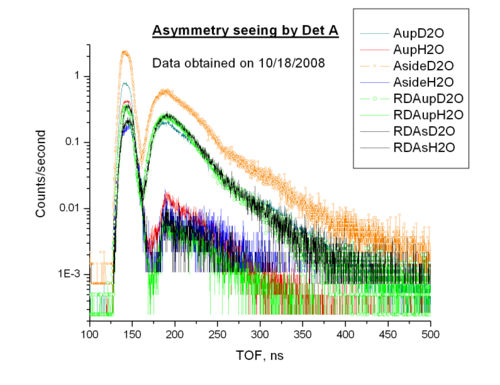
Calibration used 0.19 ns/channel. -peak positions were matched manually.
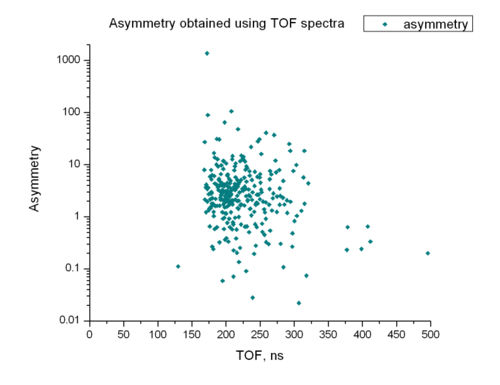
The following plot was drawn using upper plot and formula for calculation of asymmetry placed at [[1]]


