Difference between revisions of "Peaks fitting"
Jump to navigation
Jump to search
| (One intermediate revision by the same user not shown) | |||
| Line 1: | Line 1: | ||
[[Greatfit.m (Matlab program fot fitting)]] | [[Greatfit.m (Matlab program fot fitting)]] | ||
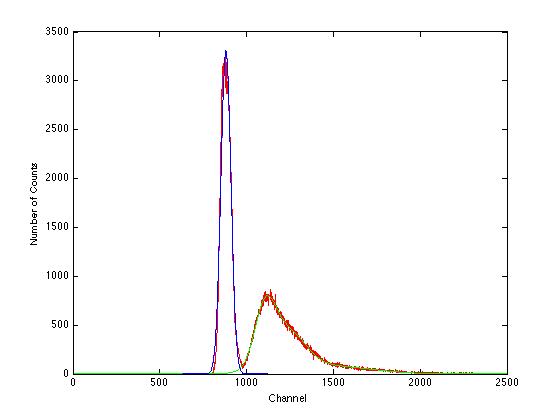
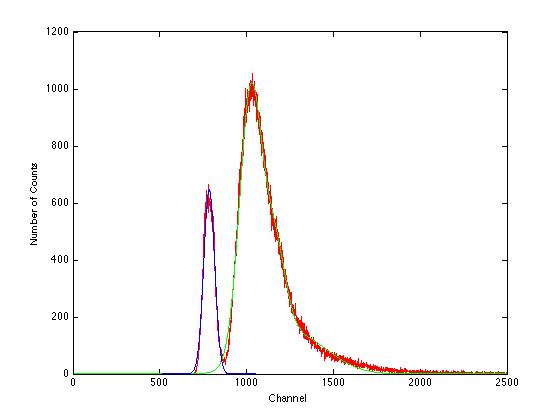
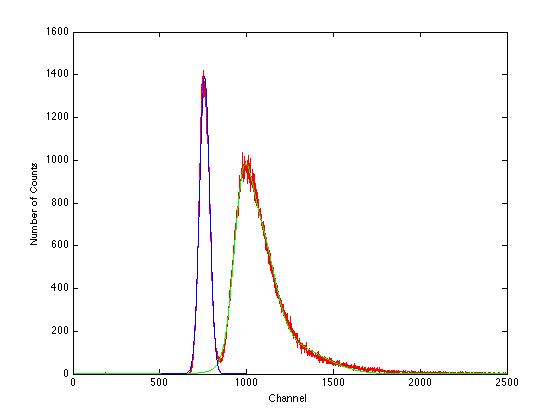
| − | The above program is used to estimate the number of counts in the neutron peak. It has been fitted by gaussian functions. Estimation was performed for run # 1 (file pf_10_10_08_00040.asc) with D2O target and detector A above the target. Ratio of the area under the fitting curve (green) to the area under the neutron peak (red)is between 1 and 2% for all three detectors. | + | The above program is used to estimate the number of counts in the neutron peak. It has been fitted by gaussian functions. Estimation was performed for run # 1 (file pf_10_10_08_00040.asc) with D2O target and detector A above the target. Ratio of the area under the fitting curve (green) to the area under the neutron peak (red)is between 1 and 2% for all three detectors (see below fits for detectors A, C and reference detector). |
[[Image:Fit4.jpg]] | [[Image:Fit4.jpg]] | ||
| Line 9: | Line 9: | ||
| − | [http:// | + | [http://wiki.iac.isu.edu/index.php/PhotoFission_with_Polarized_Photons_from_HRRL Go Back] |
Latest revision as of 06:19, 5 February 2009
Greatfit.m (Matlab program fot fitting)
The above program is used to estimate the number of counts in the neutron peak. It has been fitted by gaussian functions. Estimation was performed for run # 1 (file pf_10_10_08_00040.asc) with D2O target and detector A above the target. Ratio of the area under the fitting curve (green) to the area under the neutron peak (red)is between 1 and 2% for all three detectors (see below fits for detectors A, C and reference detector).


