Difference between revisions of "October 16, 2008"
| Line 26: | Line 26: | ||
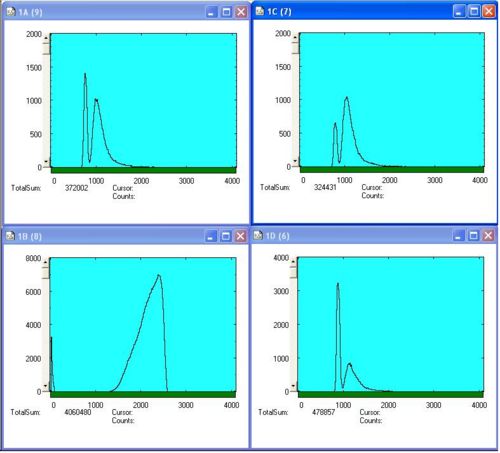
On the picture: 1D - timing spectrum taken by upper detector, 1C - timing spectrum taken by side detector, 1A - timing spectrum taken by side reference (being kept stationary) detector, 1B - NaI accelerator current monitor | On the picture: 1D - timing spectrum taken by upper detector, 1C - timing spectrum taken by side detector, 1A - timing spectrum taken by side reference (being kept stationary) detector, 1B - NaI accelerator current monitor | ||
| − | [http:// | + | [http://wiki.iac.isu.edu/index.php/October_Fission_HRRL_Measurements_2008 Go Back] |
Latest revision as of 06:31, 5 February 2009
NaI detector in place and working (used to measure the gamma flash).
Asymmetry was observed for :
is the number of neutrons/sec seen by the detector when placed above the target.
is the number of neutrons/sec seen by the detector when placed to the side of the target.
is the number of neutrons/sec seen by the detector when placed above the target.
is the number of neutrons/sec seen by the detector when placed to the side of the target.
is the number of neutrons/sec seen by the reference detector with the target. (The reference detector is beside the place of the side detector.)
is the number of neutrons/sec seen by the reference detector with the target. (The reference detector is beside the place of the side detector.)
Detector A Asymmetry: First run = -20.27%; Second run = -19.84%
Detector C Asymmetry: First run = -12.69%; Second run = -9.16%
On the picture: 1D - timing spectrum taken by upper detector, 1C - timing spectrum taken by side detector, 1A - timing spectrum taken by side reference (being kept stationary) detector, 1B - NaI accelerator current monitor
