Difference between revisions of "Kalyan 23 May 08 2.1"
(→2) |
|||
| Line 1: | Line 1: | ||
| − | ==3 inch, 0.1 inch thk carbon rod== | + | ==3 inch Dia, 0.1 inch thk carbon rod== |
The report generated by ANSYS is available: [[Image:Analysis_O_slice_3,0.1_1.pdf]] | The report generated by ANSYS is available: [[Image:Analysis_O_slice_3,0.1_1.pdf]] | ||
| + | |||
| + | |||
| + | {| align="center" | ||
| + | |- | ||
| + | |[[Image:R3_3D_Analysis_slice_O_3,0.1_1d.png| 600 px]] | ||
| + | |} | ||
| + | |||
| + | {| | ||
| + | |[[Image:R3_3D_Analysis_slice_O_3,0.1_1x.png| 410 px]]||[[Image:R3_3D_Analysis_slice_O_3,0.1_1y.png| 410 px]]||[[Image:R3_3D_Analysis_slice_O_3,0.1_1z.png| 410 px]] | ||
| + | |||
| + | |} | ||
| + | |||
| + | Figure 1: Images of Deflection for Sector 1 with 3 inch Diameter, 0.1 Inch thk carbon rods in D,X,Y,Z Directions respectively | ||
| + | |||
| + | |||
| + | |||
| + | ==3.5 inch Dia, 0.1 Inch thk== | ||
| + | |||
| + | |||
| + | The report generated by ANSYS is available: [[Image:Analysis_O_3.5,0.1_slice_1.pdf]] | ||
| + | |||
| + | |||
| + | {| align="center" | ||
| + | |- | ||
| + | |[[Image:R3_3D_AAnalysis_O_3.5,0.1_slice_1d.png| 600 px]] | ||
| + | |} | ||
| + | |||
| + | {| | ||
| + | |[[Image:R3_3D_Analysis_O_3.5,0.1_slice_1x.png| 410 px]]||[[Image:R3_3D_Analysis_O_3.5,0.1_slice_1y.png| 410 px]]||[[Image:R3_3D_Analysis_O_3.5,0.1_slice_1z.png| 410 px]] | ||
| + | |||
| + | |} | ||
| + | |||
| + | Figure 2: Images of Deflection for Sector 1 with 3.5 inch Diameter, 0.1 Inch thk carbon rods in D,X,Y,Z Directions respectively | ||
| + | |||
| + | |||
| + | ==3.5 inch Dia, 0.2 Inch thk== | ||
| + | |||
| + | |||
| + | The report generated by ANSYS is available: [[Image:Analysis_O_3.5,0.2_slice_1.pdf]] | ||
| Line 8: | Line 47: | ||
{| align="center" | {| align="center" | ||
|- | |- | ||
| − | |[[Image: | + | |[[Image:R3_3D_AAnalysis_O_3.5,0.2_slice_1d.png| 600 px]] |
|} | |} | ||
{| | {| | ||
| − | |[[Image: | + | |[[Image:R3_3D_Analysis_O_3.5,0.2_slice_1x.png| 410 px]]||[[Image:R3_3D_Analysis_O_3.5,0.2_slice_1y.png| 410 px]]||[[Image:R3_3D_Analysis_O_3.5,0.2_slice_1z.png| 410 px]] |
|} | |} | ||
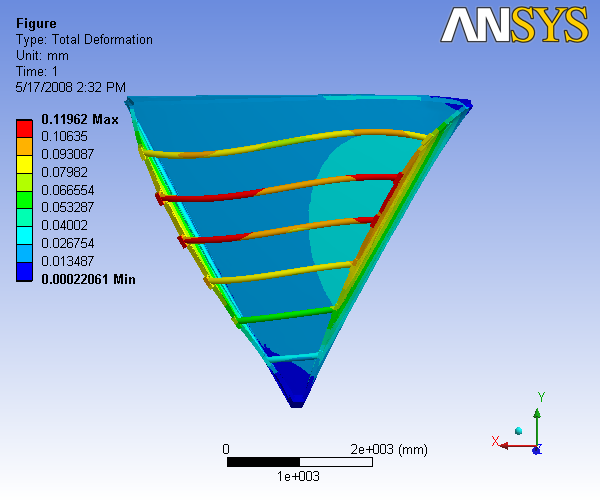
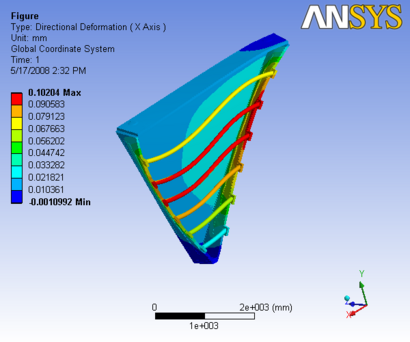
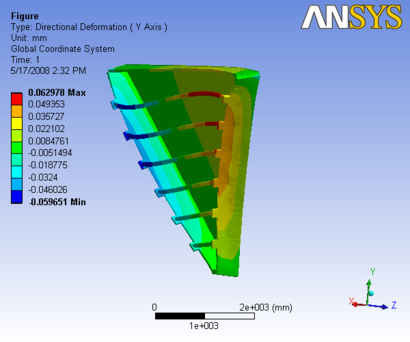
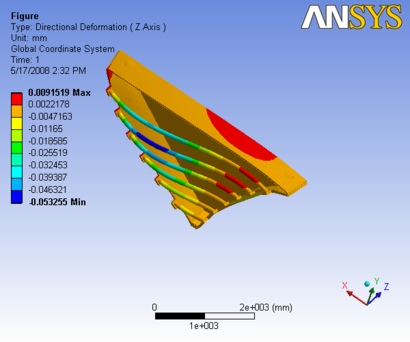
| − | Figure | + | Figure 3: Images of Deflection for Sector 1 with 3.5 inch Diameter, 0.2 Inch thk carbon rods in D,X,Y,Z Directions respectively |
| + | |||
| − | ==3.5 inch Dia, 0. | + | ==3.5 inch Dia, 0.3 Inch thk== |
| − | The report generated by ANSYS is available: [[Image:Analysis_O_3,0. | + | The report generated by ANSYS is available: [[Image:Analysis_O_3.5,0.3_slice_1.pdf]] |
| Line 28: | Line 68: | ||
{| align="center" | {| align="center" | ||
|- | |- | ||
| − | |[[Image: | + | |[[Image:R3_3D_Analysis_O_3.5,0.3_slice_1d.png| 600 px]] |
|} | |} | ||
{| | {| | ||
| − | |[[Image: | + | |[[Image:R3_3D_Analysis_O_3.5,0.3_slice_1x.png| 410 px]]||[[Image:R3_3D_Analysis_O_3.5,0.3_slice_1y.png| 410 px]]||[[Image:R3_3D_Analysis_O_3.5,0.3_slice_1z.png| 410 px]] |
|} | |} | ||
| − | Figure | + | Figure 4: Images of Deflection for Sector 1 with 3.5 inch Diameter, 0.3 Inch thk carbon rods in D,X,Y,Z Directions respectively |
Revision as of 10:37, 20 May 2008
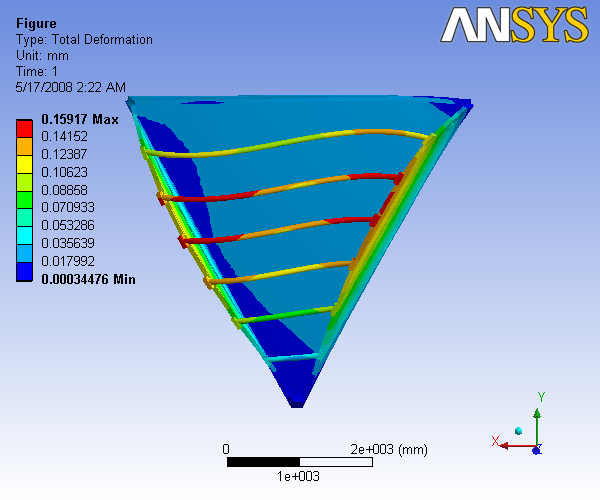
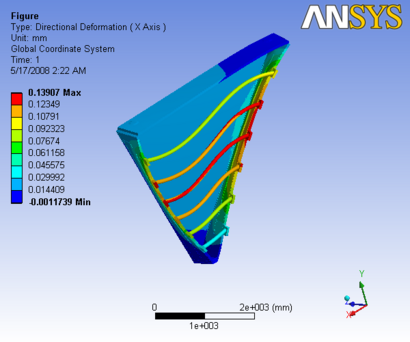
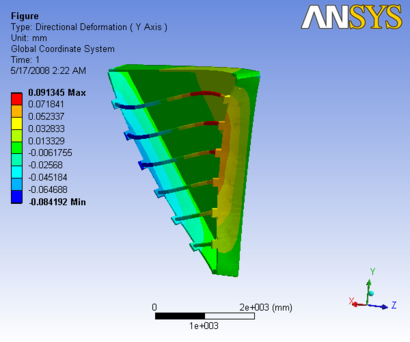
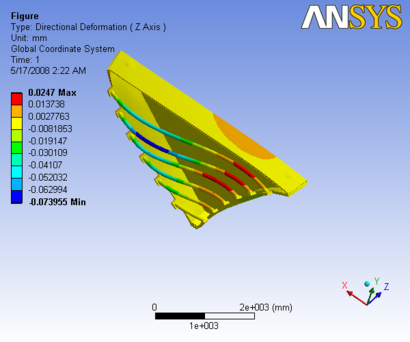
3 inch Dia, 0.1 inch thk carbon rod
The report generated by ANSYS is available: File:Analysis O slice 3,0.1 1.pdf
|
 |
 |
|
Figure 1: Images of Deflection for Sector 1 with 3 inch Diameter, 0.1 Inch thk carbon rods in D,X,Y,Z Directions respectively
3.5 inch Dia, 0.1 Inch thk
The report generated by ANSYS is available: File:Analysis O 3.5,0.1 slice 1.pdf
|
 |
 |
|
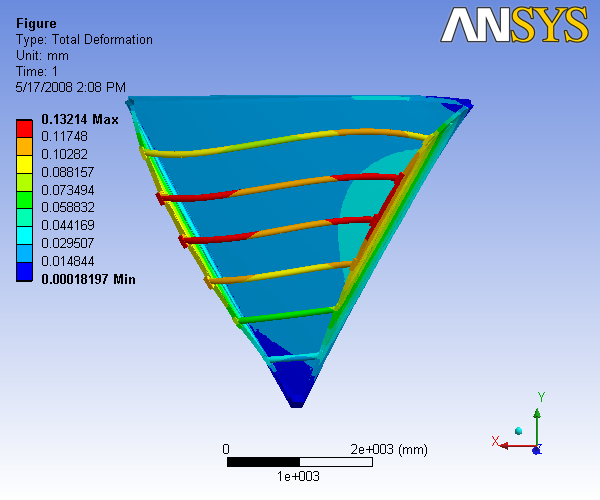
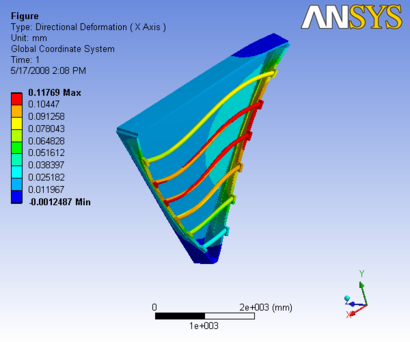
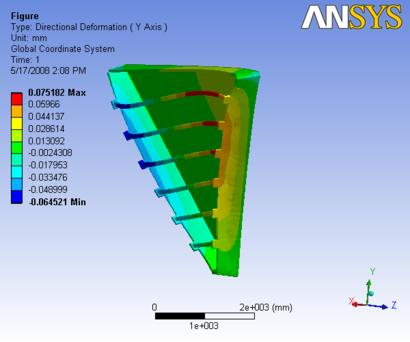
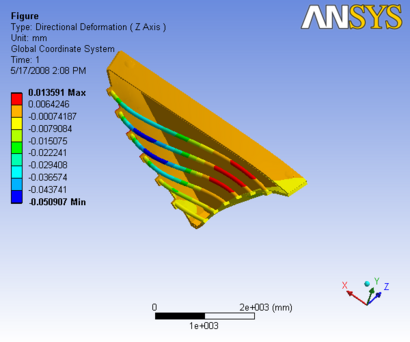
Figure 2: Images of Deflection for Sector 1 with 3.5 inch Diameter, 0.1 Inch thk carbon rods in D,X,Y,Z Directions respectively
3.5 inch Dia, 0.2 Inch thk
The report generated by ANSYS is available: File:Analysis O 3.5,0.2 slice 1.pdf
|
 |
 |
|
Figure 3: Images of Deflection for Sector 1 with 3.5 inch Diameter, 0.2 Inch thk carbon rods in D,X,Y,Z Directions respectively
3.5 inch Dia, 0.3 Inch thk
The report generated by ANSYS is available: File:Analysis O 3.5,0.3 slice 1.pdf
|
 |
 |
|
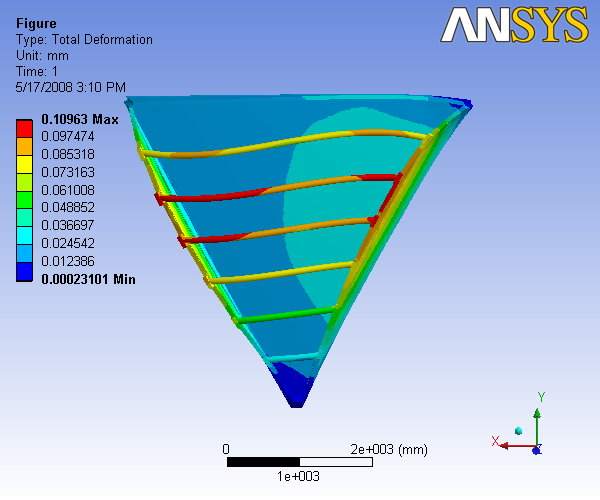
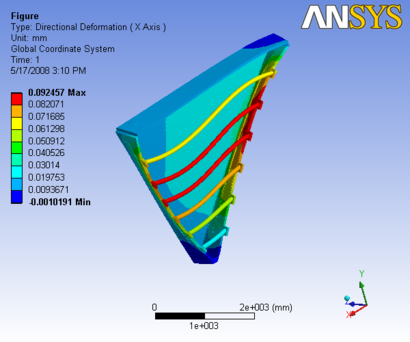
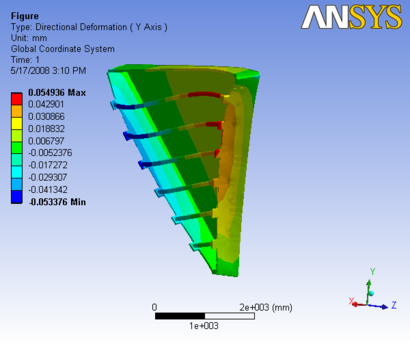
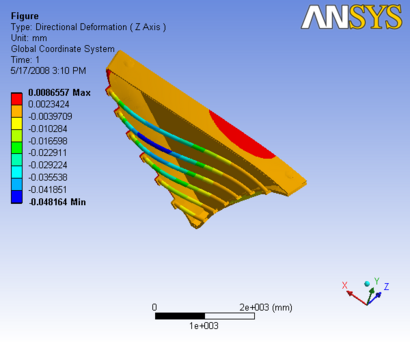
Figure 4: Images of Deflection for Sector 1 with 3.5 inch Diameter, 0.3 Inch thk carbon rods in D,X,Y,Z Directions respectively