Difference between revisions of "Kalyan 16 may 08"
| Line 8: | Line 8: | ||
| Analysis No. || E Max || D Max || X Max || Y Max || Z Max | | Analysis No. || E Max || D Max || X Max || Y Max || Z Max | ||
|- | |- | ||
| − | | Sector 1 || 0.196 || 0.221 || 0.195 || 0.126|| 0. | + | | Sector 1 || 0.196 || 0.221 || 0.195 || 0.126|| -0.088 |
|- | |- | ||
| Sector 2 || 0.158 || 0.234 || 0.089 || -0.233 ||-0.047 | | Sector 2 || 0.158 || 0.234 || 0.089 || -0.233 ||-0.047 | ||
Latest revision as of 22:17, 16 May 2008
Table of Results
| Deformation (mm) | |||||
| Analysis No. | E Max | D Max | X Max | Y Max | Z Max |
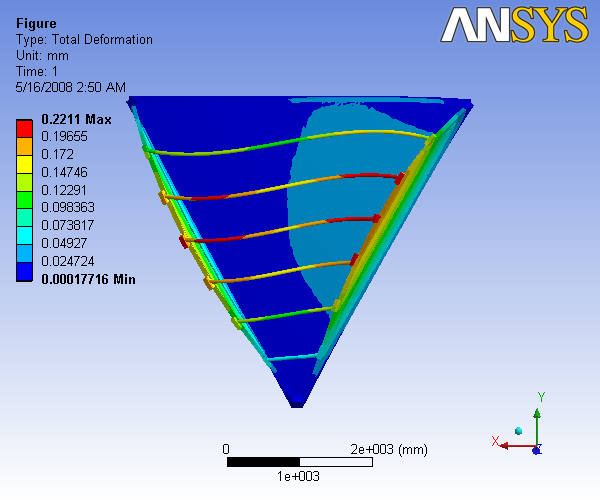
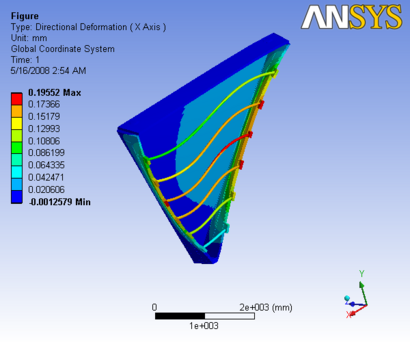
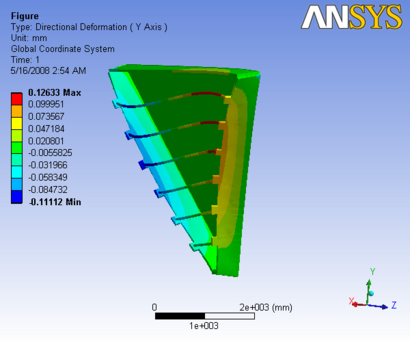
| Sector 1 | 0.196 | 0.221 | 0.195 | 0.126 | -0.088 |
| Sector 2 | 0.158 | 0.234 | 0.089 | -0.233 | -0.047 |
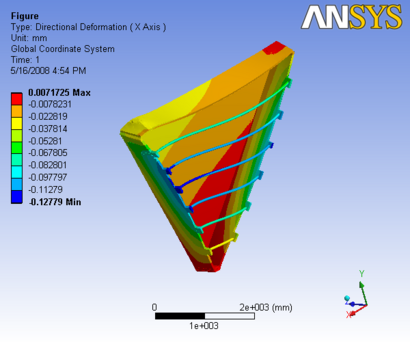
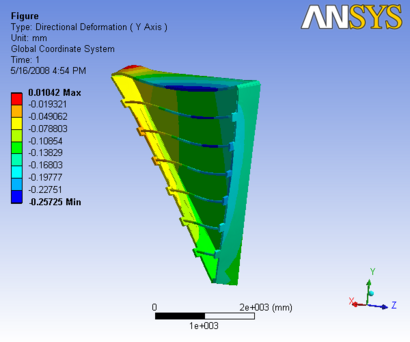
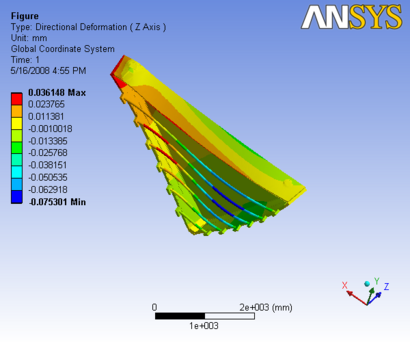
| Sector 3 | 0.236 | 0.262 | -0.127 | -0.257 | -0.075 |
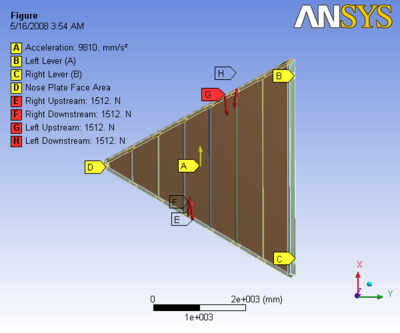
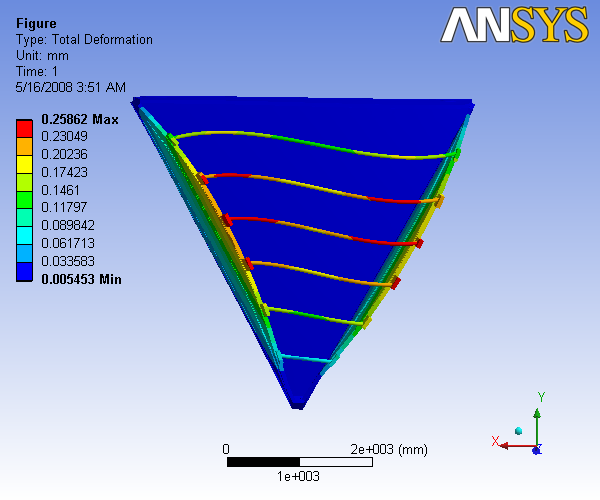
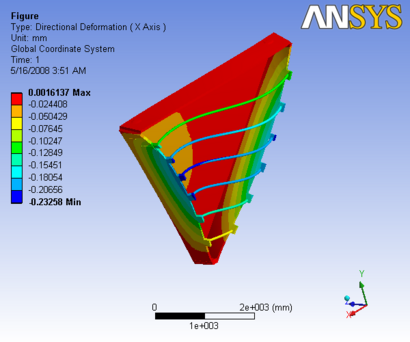
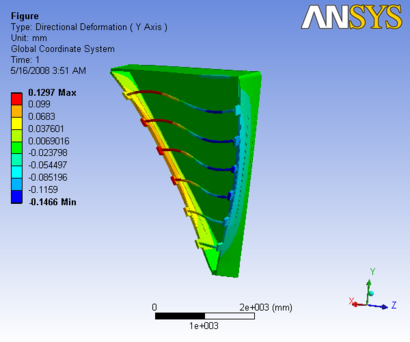
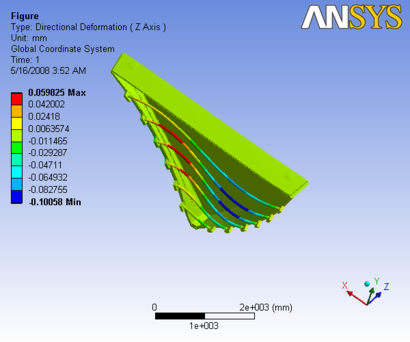
| Sector 4 | 0.230 | 0.258 | -0.232 | -0.146 | -0.100 |
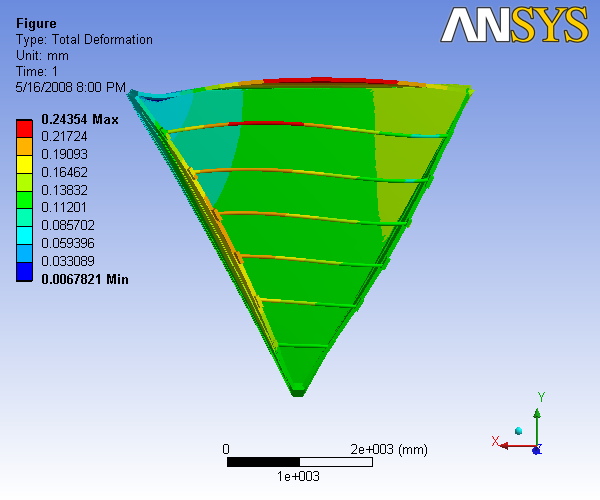
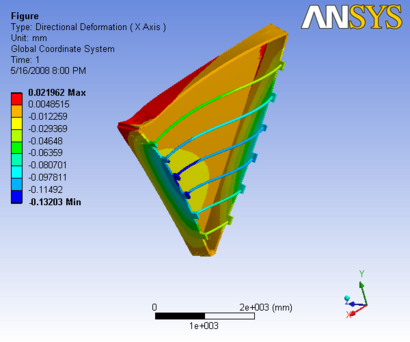
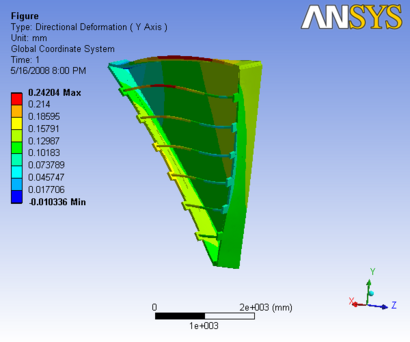
| Sector 5 | 0.190 | 0.243 | -0.132 | 0.242 | -0.050 |
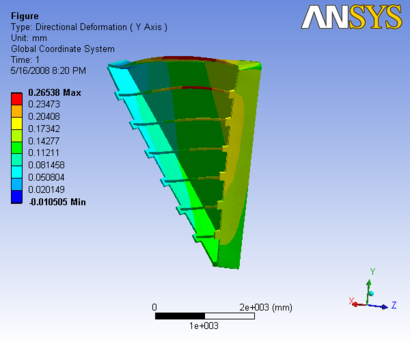
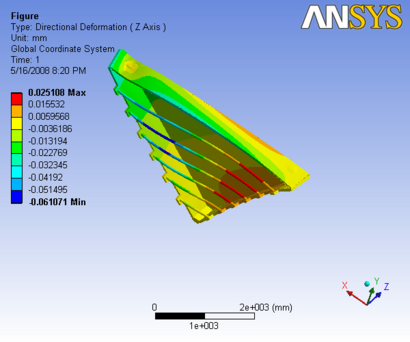
| Sector 6 | 0.213 | 0.266 | 0.099 | 0.265 | -0.061 |
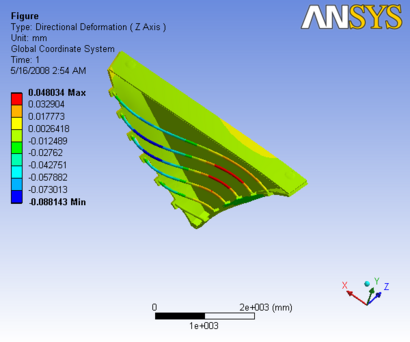
Sector 1
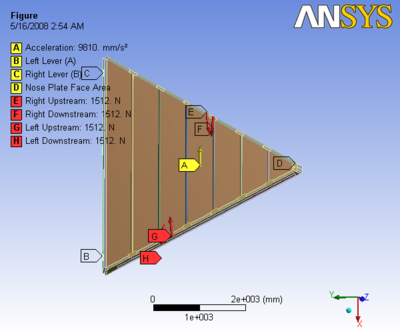
Analysis 1 Includes just the sector orientation 1 with slices of steel and carbon fiber on polyurethane and Hexcel respectively.
The report generated by ANSYS is available: File:Analysis O slice 1.pdf
 |
|
 |
 |
|
Figure 1: Images of Deflection for Sector 1 Analysis in D,X,Y,Z Directions respectively
Sector 2
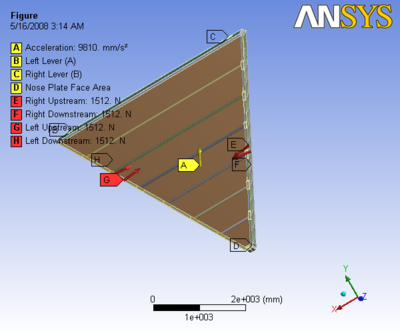
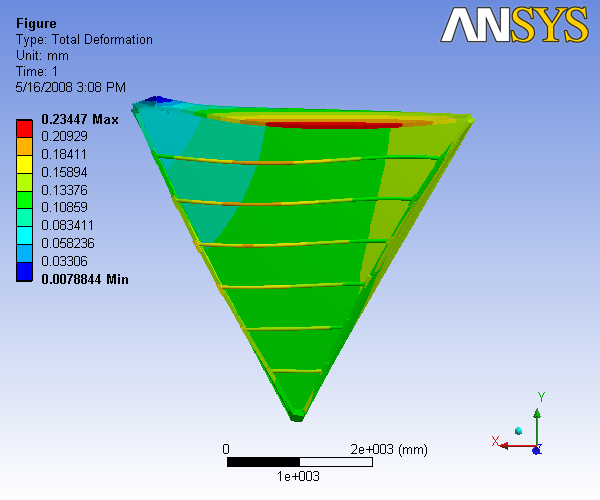
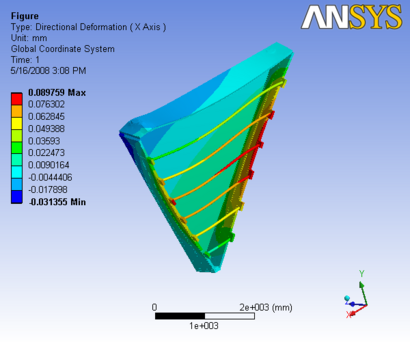
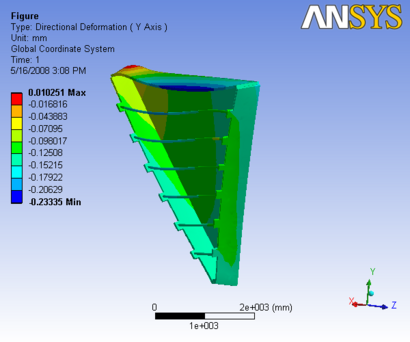
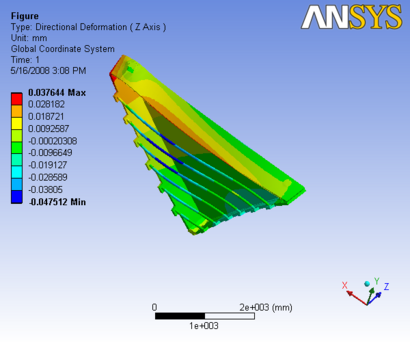
Analysis 2 Includes just the sector orientation 2 with slices of steel and carbon fiber on polyurethane and Hexcel respectively.
The report generated by ANSYS is available: File:Analysis O slice 2.pdf
 |
|
 |
 |
|
Figure 2: Images of Deflection for Sector 2 Analysis in D,X,Y,Z Directions respectively
Sector 3
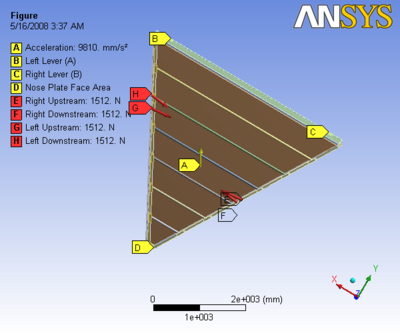
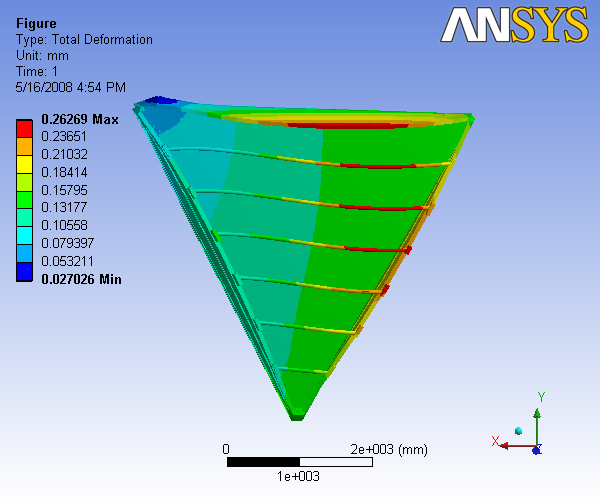
Analysis 3 Includes just the sector orientation 3 with slices of steel and carbon fiber on polyurethane and Hexcel respectively.
The report generated by ANSYS is available: File:Analysis O slice 3.pdf
 |
|
 |
 |
|
Figure 3: Images of Deflection for Sector 3 Analysis in D,X,Y,Z Directions respectively
Sector 4
Analysis 4 Includes just the sector orientation 4 with slices of steel and carbon fiber on polyurethane and Hexcel respectively.
The report generated by ANSYS is available: File:Analysis O slice 4.pdf
 |
|
 |
 |
|
Figure 4: Images of Deflection for Sector 4 Analysis in D,X,Y,Z Directions respectively
Sector 5
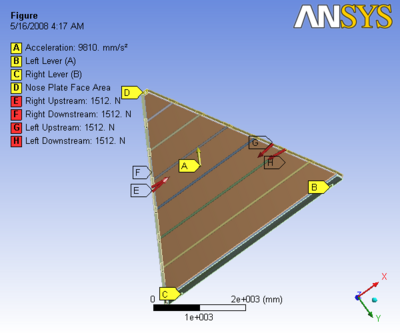
Analysis 5 Includes just the sector orientation 5 with slices of steel and carbon fiber on polyurethane and Hexcel respectively.
The report generated by ANSYS is available: File:Analysis O slice 5.pdf
 |
|
 |
 |
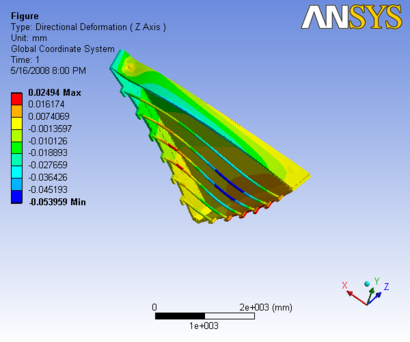
|
Figure 5: Images of Deflection for Sector 5 Analysis in D,X,Y,Z Directions respectively
Sector 6
Analysis 6 Includes just the sector orientation 6 with slices of steel and carbon fiber on polyurethane and Hexcel respectively.
The report generated by ANSYS is available: File:Analysis O slice 6.pdf
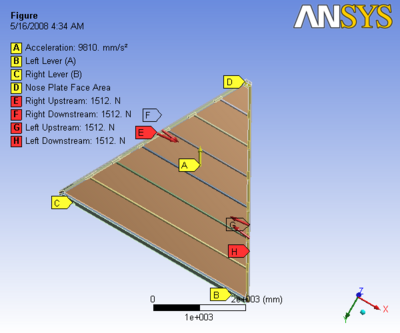 |
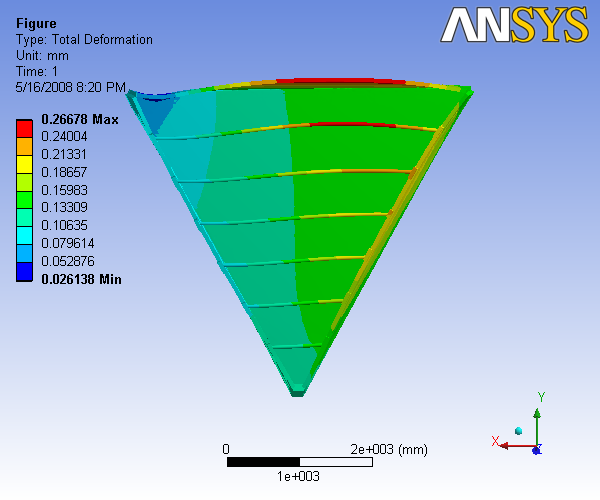
|
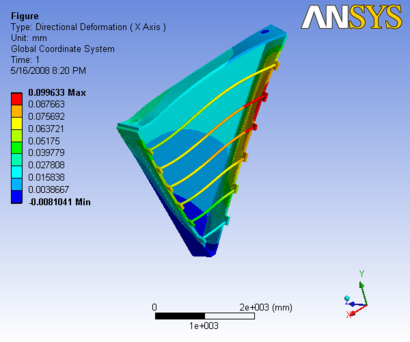 |
 |
|
Figure 6: Images of Deflection for Sector 6 Analysis in D,X,Y,Z Directions respectively