Difference between revisions of "PbFl RadTests-12-3-07"
| (34 intermediate revisions by the same user not shown) | |||
| Line 47: | Line 47: | ||
==Course scan of z=15cm== | ==Course scan of z=15cm== | ||
| + | Units are in inches for ''x'' and ''y''. | ||
Course scan of z=15cm was taken away from the Al window with dimensions in inches and the intensity measured in Volt <math>\times</math> ns | Course scan of z=15cm was taken away from the Al window with dimensions in inches and the intensity measured in Volt <math>\times</math> ns | ||
| Line 55: | Line 56: | ||
Data file for the above picutre is comma deliminated and formated as X,Y,Z. I belief X (Beam left/right), Y is beam Up/Down, and Z is the integrated scope output (in 50 <math>\Omega</math>) with units of (Volts <math>\times</math> ns )[[Media:PbF2_FineeScan_Z-15cm.dat.txt]] | Data file for the above picutre is comma deliminated and formated as X,Y,Z. I belief X (Beam left/right), Y is beam Up/Down, and Z is the integrated scope output (in 50 <math>\Omega</math>) with units of (Volts <math>\times</math> ns )[[Media:PbF2_FineeScan_Z-15cm.dat.txt]] | ||
| + | |||
| + | == Beam Scan 5 cm x 5 cm at 30 cm from window== | ||
| + | |||
| + | A fine beam scan at the location of the front of the PbF2 crystal | ||
| + | |||
| + | [[Image:PbF2FineScan_Z-30cm.jpg]] | ||
=Task 3: Linearity tests of the pickup coil and FC.= | =Task 3: Linearity tests of the pickup coil and FC.= | ||
We will just change the width of the pulse and compare the readings from the pickup coil to that of the FC. Note that change in 1mV from the pickup coil corresponds to 1mA change in the instantaneous beam current. | We will just change the width of the pulse and compare the readings from the pickup coil to that of the FC. Note that change in 1mV from the pickup coil corresponds to 1mA change in the instantaneous beam current. | ||
| + | |||
| + | The beam energy may change if we change the pulse width so we decided to change the frequency | ||
| + | |||
| + | Beam at 50mA peak, 100 ns, and at the frequency given in the table below below | ||
| + | |||
| + | '''The pick up loop was a split signal between MCC and Us so you need to multiple by 2 for an absolute measurement''' | ||
| + | |||
| + | The FC was not split. | ||
| + | |||
| + | {| border="1" | ||
| + | | Frequency (Hz) | ||
| + | | pickup coil (P2P mV) | ||
| + | | FC (mV) | ||
| + | |- | ||
| + | | 1 | ||
| + | | 21.5 (26.1789 V ns) | ||
| + | | 312 (28.4168 V ns) | ||
| + | |- | ||
| + | | 10 | ||
| + | | 23.4 (27.8362) | ||
| + | | 359 (32.132 ) | ||
| + | |- | ||
| + | | 20 | ||
| + | | 24 (28.668) | ||
| + | | 368 (33.177) | ||
| + | |- | ||
| + | | 30 | ||
| + | | 24.3 (29.093) | ||
| + | | 371 (33.67) | ||
| + | |- | ||
| + | | 50 | ||
| + | | 24.2(28.708) | ||
| + | | 369(33.025) | ||
| + | |- | ||
| + | | 100 | ||
| + | | 25.5(30.413) Acc changed so we had to go back, a lot of jitter here | ||
| + | | 393(35.44) | ||
| + | |- | ||
| + | |} | ||
| + | |||
| + | |||
| + | Too many problems with beam jitter after 100 Hz | ||
| + | |||
| + | We now try to use the line sync frequencies. | ||
| + | |||
| + | {| border="1" | ||
| + | | Frequency (Hz) | ||
| + | | pickup coil (P2P mV) | ||
| + | | FC (mV) | ||
| + | |- | ||
| + | | 0.9375 | ||
| + | | 26.1 (3.0785V ns) | ||
| + | | 408 (36.48V ns) | ||
| + | |- | ||
| + | | 60 | ||
| + | | 26.8 (3.146 V ns) | ||
| + | | 412 (36.422 V ns) | ||
| + | |- | ||
| + | } | ||
| + | |||
| + | |||
| + | 300 Hz is max without increasing width. *T. Forest's recollection is that it was run at 10 Hz.* | ||
{| border="1" | {| border="1" | ||
| Line 66: | Line 135: | ||
|- | |- | ||
| 0.08 | | 0.08 | ||
| − | | | + | | 25.6 (2.63) |
| − | | | + | | 386 () |
|- | |- | ||
| | | | ||
0.10 | 0.10 | ||
| − | | | + | | 26.7 (3.08) |
| − | | | + | | 413 (38.068) |
|- | |- | ||
| | | | ||
0.16 | 0.16 | ||
| − | | | + | | 28.7 (4.6958) |
| − | | | + | | 436 () |
|- | |- | ||
| 0.30 | | 0.30 | ||
| − | | | + | | 31.7 (9.31) |
| − | | | + | | 475 (107.18) |
|- | |- | ||
| 0.50 | | 0.50 | ||
| − | | | + | | 32.1 (15.216) |
| − | | | + | | 474 (168.9) |
|- | |- | ||
| 0.75 | | 0.75 | ||
| − | | | + | | 31.4 (22.025) |
| − | | | + | | 476 (266.61) |
|- | |- | ||
| 1.00 | | 1.00 | ||
| − | | | + | | 31.3 (31.061) |
| − | | | + | | 474 (344.30) |
|- | |- | ||
| − | | 2.00 | + | | 2.00 (shot # 546) |
| − | | | + | | 27 (36.06) |
| − | | | + | | 467 (539.01) |
|} | |} | ||
| + | |||
| + | Graph: [[Image:Coilfcpulsewidth.JPG | 600 px]] | ||
| + | |||
| + | We will repeat the measurements with the line sync at 15 Hz and 30 Hz. | ||
| Line 118: | Line 191: | ||
Starting temp: <math>22.9^0</math> C | Starting temp: <math>22.9^0</math> C | ||
| − | after 600 seconds :24.1 | + | after 600 seconds :<math>24.1^0</math> C |
== 3 Watt power at 30 cm away from window== | == 3 Watt power at 30 cm away from window== | ||
| Line 125: | Line 198: | ||
Starting temp: 23.8 | Starting temp: 23.8 | ||
after 300 sec: 24.8 | after 300 sec: 24.8 | ||
| − | after 600 seconds : | + | after 600 seconds :26.05 |
| + | Beam off | ||
| + | |||
| + | Equilibrated to 26.8 after beam off | ||
| + | {| border="1" | ||
| + | | Time (sec) | ||
| + | | Temp (C) | ||
| + | |- | ||
| + | | 0 | ||
| + | | 26.8 | ||
| + | |- | ||
| + | | 60 | ||
| + | | 26.1 | ||
| + | |- | ||
| + | | 120 | ||
| + | | 25.8 | ||
| + | |- | ||
| + | | | ||
| + | |} | ||
== 10 Watt power at 30 cm away from window== | == 10 Watt power at 30 cm away from window== | ||
Using beam conditions of 50 mA, '''100 Hz''', 100 nsec pulse width we ran for 10 minutes and looked for temperature change. | Using beam conditions of 50 mA, '''100 Hz''', 100 nsec pulse width we ran for 10 minutes and looked for temperature change. | ||
| − | + | Warm up | |
| − | + | {| border="1" | |
| + | | Time (sec) | ||
| + | | Temp (C) | ||
| + | |- | ||
| + | | 0 | ||
| + | | 24.4 | ||
| + | |- | ||
| + | | 240 | ||
| + | | 25 | ||
| + | |- | ||
| + | | 420 | ||
| + | | 26.2 | ||
| + | |- | ||
| + | | 600 | ||
| + | | 27.3 | ||
| + | |- | ||
| + | | | ||
| + | |} | ||
| + | |||
| + | Beam off | ||
| + | |||
| + | {| border="1" | ||
| + | | Time (sec) | ||
| + | | Temp (C) | ||
| + | |- | ||
| + | | 660 | ||
| + | | 27.6 | ||
| + | |- | ||
| + | | 795 | ||
| + | | 27.9 | ||
| + | |- | ||
| + | | 1200 | ||
| + | | 271. | ||
| + | |- | ||
| + | | | ||
| + | | | ||
| + | |- | ||
| + | | | ||
| + | |} | ||
| + | |||
| + | After irradiation: 5mR/hr at time 14:00 | ||
| + | |||
| + | 2mR/hr | ||
| + | 2mR/hr | ||
| + | 2.2mR/hr | ||
| + | 3.0mR/hr (side opposite thermocouple) | ||
| + | Chad O'Neill 15:05 12/3/07 | ||
| + | |||
| + | After 1:42 | ||
| + | 2mR/hr | ||
| + | 1.8mR/hr | ||
| + | 3.0mR/hr | ||
| + | 2mR/hr | ||
| + | |||
| + | |||
| + | # Block 16 irradiated for 1 hour & left in hall to cool until next morning. | ||
| − | |||
| − | |||
| − | |||
| − | |||
| − | |||
| − | |||
| − | |||
[http://www.iac.isu.edu/mediawiki/index.php/IAC_LeadFlourideCherenkovCrystalTests Go Back] | [http://www.iac.isu.edu/mediawiki/index.php/IAC_LeadFlourideCherenkovCrystalTests Go Back] | ||
Latest revision as of 17:25, 5 December 2007
Day 1. December 3, 2007. MONDAY
Shift Personnel
| Collaborator | Shift |
| Amine | 8-10 am , 2-4 pm |
| P. Bertin | 8am - 5 pm |
| Syed | 8 am - noon |
| T. Forest | 10 am - 2pm |
Task 1: Tune Beam
The first task will be to establish reproducable running conditions using the beam parameters given on the Main page.
This ask will also require that the FC and Pickup Coil be positioned and operating as well.
Task 2: Emmittance
Once stable beam operations are in place, we will insert two glass slides on the translator platform positioned 10 and 30 cm away from the Aluminum cooled exit window. Put beam on the windows and watch on the camera until the glass slides change color showing the beam envelope.
Next move the translator board to align the large glass plate at 50 cm away from the window and measure the beam profile
Glass Slides at 10 cm, 30 cm, and 50 cm.
Brett says the electron beam is focused to 1 mm in diameter before it strikes the exit window. After it passes throught the water-cooled exit window (Al 1mm - Water 1mm - Al 1mm), the beam swells to 6.0mm and at 30cm it the beam spot size is 2cm.
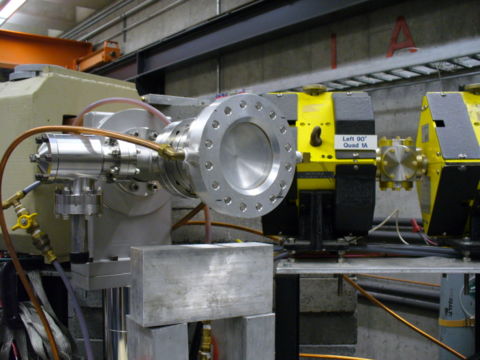
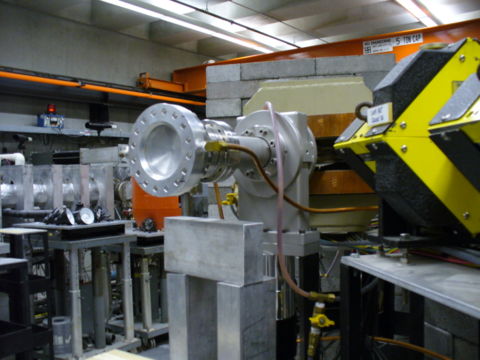
Here are two views of the exit window
Beam spot size mapping in x and y with the Faraday Cup (FC) for z = 30cm from Window.
We will move the table in or out depending on whether the beam spot size is greater or smaller than 2.0 cm. Translator table will be positioned at right position in z.
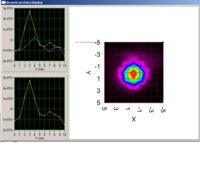
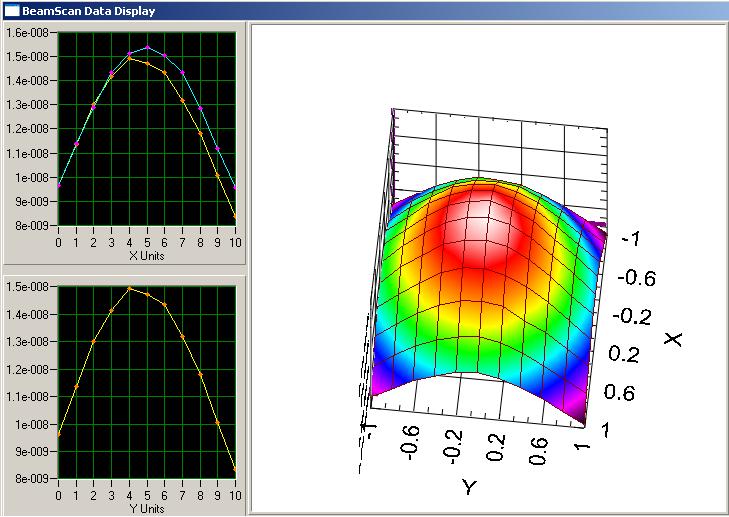
Course scan of z=15cm
Units are in inches for x and y. Course scan of z=15cm was taken away from the Al window with dimensions in inches and the intensity measured in Volt ns
Data file for the above picutre is comma deliminated and formated as X,Y,Z. I belief X (Beam left/right), Y is beam Up/Down, and Z is the integrated scope output (in 50 ) with units of (Volts ns )Media:PbF2_FineeScan_Z-15cm.dat.txt
Beam Scan 5 cm x 5 cm at 30 cm from window
A fine beam scan at the location of the front of the PbF2 crystal
Task 3: Linearity tests of the pickup coil and FC.
We will just change the width of the pulse and compare the readings from the pickup coil to that of the FC. Note that change in 1mV from the pickup coil corresponds to 1mA change in the instantaneous beam current.
The beam energy may change if we change the pulse width so we decided to change the frequency
Beam at 50mA peak, 100 ns, and at the frequency given in the table below below
The pick up loop was a split signal between MCC and Us so you need to multiple by 2 for an absolute measurement
The FC was not split.
| Frequency (Hz) | pickup coil (P2P mV) | FC (mV) |
| 1 | 21.5 (26.1789 V ns) | 312 (28.4168 V ns) |
| 10 | 23.4 (27.8362) | 359 (32.132 ) |
| 20 | 24 (28.668) | 368 (33.177) |
| 30 | 24.3 (29.093) | 371 (33.67) |
| 50 | 24.2(28.708) | 369(33.025) |
| 100 | 25.5(30.413) Acc changed so we had to go back, a lot of jitter here | 393(35.44) |
Too many problems with beam jitter after 100 Hz
We now try to use the line sync frequencies.
} 300 Hz is max without increasing width. *T. Forest's recollection is that it was run at 10 Hz.*| Frequency (Hz) | pickup coil (P2P mV) | FC (mV) |
| 0.9375 | 26.1 (3.0785V ns) | 408 (36.48V ns) |
| 60 | 26.8 (3.146 V ns) | 412 (36.422 V ns) |
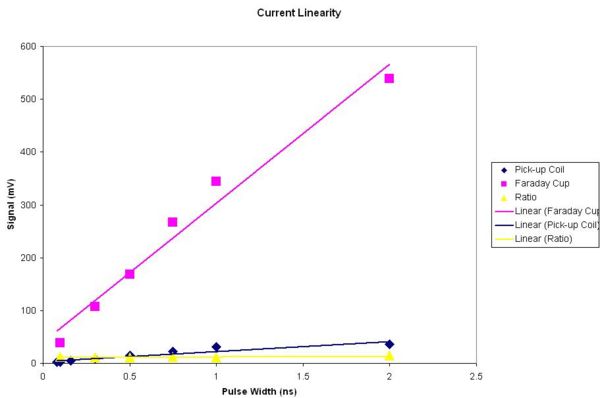
| Pulse Width (us) | pickup coil (mV) | FC (mV) |
| 0.08 | 25.6 (2.63) | 386 () |
|
0.10 |
26.7 (3.08) | 413 (38.068) |
|
0.16 |
28.7 (4.6958) | 436 () |
| 0.30 | 31.7 (9.31) | 475 (107.18) |
| 0.50 | 32.1 (15.216) | 474 (168.9) |
| 0.75 | 31.4 (22.025) | 476 (266.61) |
| 1.00 | 31.3 (31.061) | 474 (344.30) |
| 2.00 (shot # 546) | 27 (36.06) | 467 (539.01) |
We will repeat the measurements with the line sync at 15 Hz and 30 Hz.
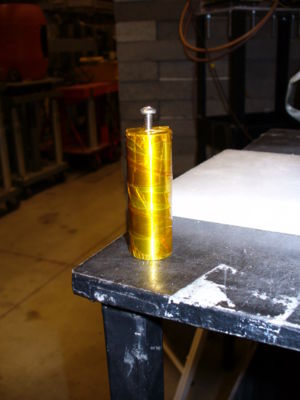
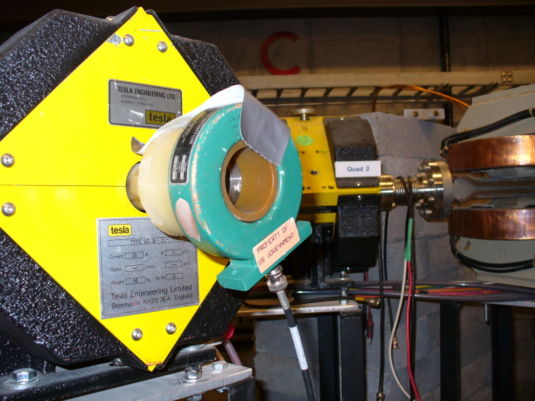
Here are Pictures of the Faraday Cup and the Pickup Coil
Task 4: 5 hours of beamtime
Recall that we cannot exceed 10 K/h
- Irradiate broken PbF2 Crystal for 0.5 h and check the rate of the rise of temperature.
We will use a Fluke monitor with a camera to look at the temperature.
1 Watt power at 30 cm away from window
Using beam conditions of 50 mA, 10 Hz, 100 nsec pulse width we ran for 10 minutes and looked for temperature change.
Starting temp: C
after 600 seconds : C
3 Watt power at 30 cm away from window
Using beam conditions of 50 mA, 30 Hz, 100 nsec pulse width we ran for 10 minutes and looked for temperature change.
Starting temp: 23.8 after 300 sec: 24.8 after 600 seconds :26.05 Beam off
Equilibrated to 26.8 after beam off
| Time (sec) | Temp (C) |
| 0 | 26.8 |
| 60 | 26.1 |
| 120 | 25.8 |
10 Watt power at 30 cm away from window
Using beam conditions of 50 mA, 100 Hz, 100 nsec pulse width we ran for 10 minutes and looked for temperature change.
Warm up
| Time (sec) | Temp (C) |
| 0 | 24.4 |
| 240 | 25 |
| 420 | 26.2 |
| 600 | 27.3 |
Beam off
| Time (sec) | Temp (C) |
| 660 | 27.6 |
| 795 | 27.9 |
| 1200 | 271. |
After irradiation: 5mR/hr at time 14:00
2mR/hr 2mR/hr 2.2mR/hr 3.0mR/hr (side opposite thermocouple) Chad O'Neill 15:05 12/3/07
After 1:42 2mR/hr 1.8mR/hr 3.0mR/hr 2mR/hr
- Block 16 irradiated for 1 hour & left in hall to cool until next morning.
