Difference between revisions of "CH ROOT Nonuniform Binning"
| (7 intermediate revisions by the same user not shown) | |||
| Line 41: | Line 41: | ||
* You can no longer use the Gd_In->Draw(); command, but instead have to use Gd_In.Draw(); This is due to the histogram not being a pointer. | * You can no longer use the Gd_In->Draw(); command, but instead have to use Gd_In.Draw(); This is due to the histogram not being a pointer. | ||
Gd_In.Draw(); | Gd_In.Draw(); | ||
| + | |||
| + | Once you've run these commands, proceed to [[CH Starting CODA & Reading CODA Data#ROOT_Commands|here]] for adding and subtracting histograms. | ||
| + | |||
| + | =C File= | ||
| + | |||
| + | The purpose of this C file is to calibrate an uncalibrated spectroscopy measurement using a nonuniform binning method subject to the energy calibration. | ||
| + | |||
| + | This C file will require a dat file in the form of 3 rows and 2 columns where column 1 is the channel number for a certain peak and the 2nd column is the energy in KeV of that photon peak. | ||
| + | |||
| + | Currently the dat file is called under the file name "temp.dat" but this can be changed. | ||
| + | |||
| + | [[File:CH_Non_Uniform_Binning.c]] | ||
| + | |||
| + | ==To Do== | ||
| + | |||
| + | Comment C file for easy use | ||
| + | |||
| + | Enter and leave TTrees and create different plots | ||
| + | |||
| + | Combine the plots into one useful histogram (including plot labels and formatting) | ||
=Plot Example= | =Plot Example= | ||
| Line 59: | Line 79: | ||
---- | ---- | ||
| + | ='''Previous Page'''= | ||
| + | |||
| + | [[CH Starting CODA & Reading CODA Data]] | ||
| + | |||
| + | [[CaGaS Phase II]] | ||
| + | |||
[[PAS Experiment]] | [[PAS Experiment]] | ||
Latest revision as of 18:06, 10 May 2022
Rebinning via Energy Calibration
Regarding use of 4096 channel peak sensing ADC and DAQ2
- Open terminal window.
- source ROOT.
source ~/src/ROOT/v6.20/builddir/bin/thisroot.csh
- Open ROOT and attach the root file you want.
root -l r####.root
- Create an array 4097 entries long to be used for bin edges.
double bins[4097];
- Open a for loop for bin creation.
for(int i=0; i<=4096; i++){
- Fill the array with values for bin edges using the energy calibration fit for HPGe detector. I used i*i here instead of i2(i**2) because the ROOT interpreter doesn't seem to enjoy proper math formulation.
bins[i] = i*i*(-0.000000861277) + i*(0.449519)-36.2928;
bins[i] = i*i*(-0.000000777206) + i*(0.44862)-36.0378; -> new
- Cout statement to print bin edges to the terminal window as for loop is processing.
cout << bins[i] << endl;
- Closes the for loop and begins evaluation.
}
At this point you should have an array filled with values for bin edges. Note that channel zero is now mapped to ~ -36KeV.
Creating a Histogram Using bins[i]
- Initialize the histogram you want to use. The value 4096 is found by (length of array) - 1, or alternatively, the length of the array is Total ADC Channels + 1.
TH1F Gd_In = TH1F("Gd_In","",4096,bins)
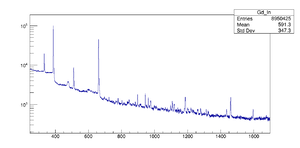
- Project the stored data from the ROOT TTree into the histogram using the same calibration used for binning. The ROOT TTree was named PAA in my case and the name of my histogram is Gd_In. I also pulled the data from channel 9 of the ADC and used a quadratic energy calibration to map from channel number to KeV.
PAA->Project("Gd_In","-36.2928+0.449519*(PADC.PADC785N[9])-0.000000861277*(PADC.PADC785N[9])*(PADC.PADC785N[9])");
- You can no longer use the Gd_In->Draw(); command, but instead have to use Gd_In.Draw(); This is due to the histogram not being a pointer.
Gd_In.Draw();
Once you've run these commands, proceed to here for adding and subtracting histograms.
C File
The purpose of this C file is to calibrate an uncalibrated spectroscopy measurement using a nonuniform binning method subject to the energy calibration.
This C file will require a dat file in the form of 3 rows and 2 columns where column 1 is the channel number for a certain peak and the 2nd column is the energy in KeV of that photon peak.
Currently the dat file is called under the file name "temp.dat" but this can be changed.
To Do
Comment C file for easy use
Enter and leave TTrees and create different plots
Combine the plots into one useful histogram (including plot labels and formatting)
Plot Example
Debugging
Error: Bins must be in increasing order
This error was thrown by having an integer at +1 the value it should have been at when making the histogram. The following should allow you to find bins that are at a lower value than the previous. This for loop will parse through the entire bins array and print the bins
for(int i=0; i<=4096; i++){
if(bins[i]>=bins[i+1]){cout << i  <<"    " << bins[i] <<"     " << bins[i+1] << endl;
}
