Difference between revisions of "2NCorr SPDP Introduction"
| Line 1: | Line 1: | ||
[[Production Analysis | go_back ]] | [[Production Analysis | go_back ]] | ||
| + | |||
| + | =The calculation of angular correlation= | ||
The neutron efficiency and acceptance of our detector array varies highly non-uniformly over the range of two-neutron opening angles (<math>\theta_{nn}</math>). This is due to the detector array's non-spherically symmetric geometry, and to its varying neutron detection efficiency as a function of both position and energy (see figure). | The neutron efficiency and acceptance of our detector array varies highly non-uniformly over the range of two-neutron opening angles (<math>\theta_{nn}</math>). This is due to the detector array's non-spherically symmetric geometry, and to its varying neutron detection efficiency as a function of both position and energy (see figure). | ||
| Line 6: | Line 8: | ||
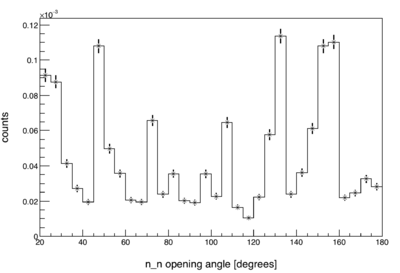
<li style="display: inline-block;"> [[File:2N Corr OpeningAngleCf252.png|thumb|400px| Measured opening angle distribution of neutrons from the spontaneous fission of Cf252.]]</li> | <li style="display: inline-block;"> [[File:2N Corr OpeningAngleCf252.png|thumb|400px| Measured opening angle distribution of neutrons from the spontaneous fission of Cf252.]]</li> | ||
| − | For this reason, every measured distribution is made meaningful by normalizing against a "control" distribution. This is done by diving the values of the measured distribution by the control distribution on a bin-by-bin basis. For <math>\theta_{nn}</math>, the control distribution is made by looking at pairs of two | + | For this reason, every measured distribution is made meaningful by normalizing against a "control" distribution. This is done by diving the values of the measured distribution by the control distribution on a bin-by-bin basis. For <math>\theta_{nn}</math>, the control distribution is made by looking at the events from pairs of two different pulses, such that the the two pulses occurred within a few 100 ms of each other. If there is a neutron event in both of the pulses in a given pair, then the opening angle between the two events is calculated. Since no information can be shared between neutrons of different pulses, the control distribution is completely free of all two-neutron correlations, however, it is still subject to the usual effects of detector geometry and efficiency as a function of position and energy. So what is meant by "angular correlation" here, is the measured rate relative to a totally uncorrelated neutron source. The plot below is the same data from the plot above after normalization. |
<div><ul> | <div><ul> | ||
Revision as of 23:04, 19 January 2018
The calculation of angular correlation
The neutron efficiency and acceptance of our detector array varies highly non-uniformly over the range of two-neutron opening angles (). This is due to the detector array's non-spherically symmetric geometry, and to its varying neutron detection efficiency as a function of both position and energy (see figure).
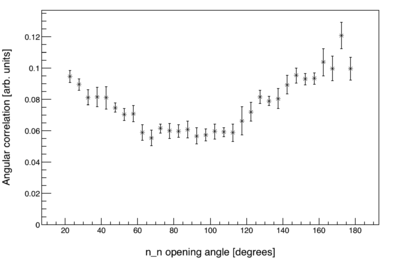
For this reason, every measured distribution is made meaningful by normalizing against a "control" distribution. This is done by diving the values of the measured distribution by the control distribution on a bin-by-bin basis. For , the control distribution is made by looking at the events from pairs of two different pulses, such that the the two pulses occurred within a few 100 ms of each other. If there is a neutron event in both of the pulses in a given pair, then the opening angle between the two events is calculated. Since no information can be shared between neutrons of different pulses, the control distribution is completely free of all two-neutron correlations, however, it is still subject to the usual effects of detector geometry and efficiency as a function of position and energy. So what is meant by "angular correlation" here, is the measured rate relative to a totally uncorrelated neutron source. The plot below is the same data from the plot above after normalization.

