Difference between revisions of "JB Absolute theta"
| Line 23: | Line 23: | ||
Here is an outline of the steps of analysis: | Here is an outline of the steps of analysis: | ||
| − | # To correct the | + | # To correct the target distribution for dead-time, multiply the rate in each detector by <math>\frac{1}{1-R_{G}}</math>, where <math>R_{G}</math> is the gamma rate in the detector. This assumes the gamma rate is constant, which makes for a good approximation since the gamma rate fluctuations are small. |
| − | # | + | # Subtract from the target distribution, a cosmics-subtracted Al target distribution. This serves to eliminate beam-related noise. |
| + | ## scale the Al distribution individually in each detector, such that the total number of gammas is equal to that of the target distribution. | ||
| + | ## Correct Al for dead-time in the same way described in step 1. | ||
| + | ## Scale cosmics distribution with the same scaling factors used for the Al distribution, and subtract the result from the Al distribution. This distribution should now contain only beam-related noise. | ||
| + | #Subtract cosmics distribution from target distribution. | ||
| + | # Divide by Cf252 distribution to get relative rate over theta_abs, in each detector. | ||
| + | |||
| + | Note: Cosmic noise from Cf252 distribution was less than 0.1% effect. | ||
[[File:D2OTheta absAnalysisSteps(1).png|650px]] | [[File:D2OTheta absAnalysisSteps(1).png|650px]] | ||
Revision as of 16:56, 9 November 2017
Overview
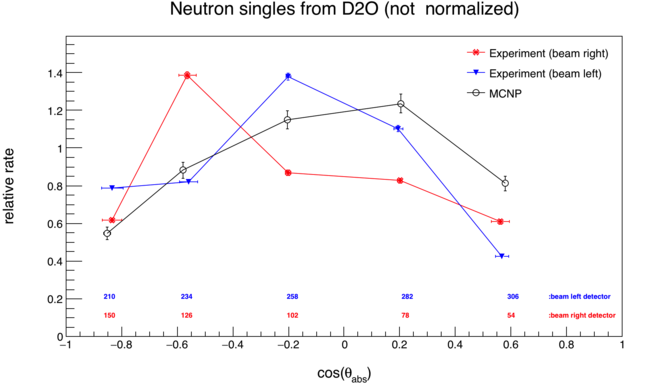
Here I use neutron single events to measure the distribution of theta_abs, or the angle between an incident photon and a resultaning photo-neutron. The distribution of uncorrelated neutrons from the SF of californium 252 is used to "divide out" the effects of detector geometry, efficiency, drifts, ect. For D2O, the result is compared to an MCNP simulation which was built to model as many aspects of the experiment as possible.
Simulation
I performed an MCNP simulation with a D2O target (axis length = 2"; dia. = 0.75") subject to a 10.5 MeV end-point bremsstrahlung beam. A mock-up of the entire neutron detector array is included in the simulation. Detector physics is modeled by applying a detection threshold in terms of light output (MeVee), which is equal to the typical MeVee produced by 0.5 MeV neutrons within the scintillator.
A Cf252 source was also simulated, allowing me to apply the exact same analysis technique to simulation and experimental data .
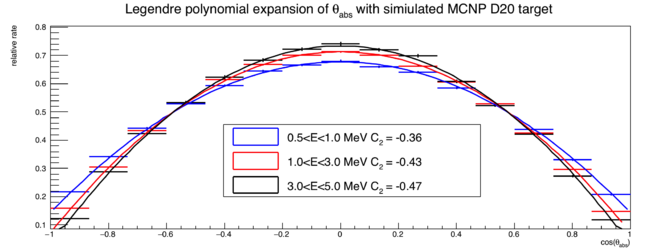
The plot below shows the relative distribution of neutron direction cosines w.r.t. the incident photon beam. These neutrons are not effected by scattering or detector geometry, since the direction cosine are taken right as neutrons are created.
Analysis
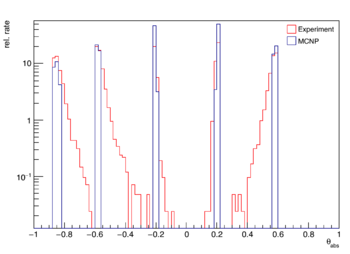
Ten detectors are used in the measurement, 5 beam left and 5 beam right. For each detector on beam left, there is a corresponding detector on beam right which covers the same range in theta_abs. Each left-right pair of detectors produces a peak in the theta_abs distribution, seen below.
During the analysis, each peak is condensed into a single point whose value on the y-axis is the mean of the peak, and is the weighted average, or "center of mass", along the x-axis.
Here is an outline of the steps of analysis:
- To correct the target distribution for dead-time, multiply the rate in each detector by , where is the gamma rate in the detector. This assumes the gamma rate is constant, which makes for a good approximation since the gamma rate fluctuations are small.
- Subtract from the target distribution, a cosmics-subtracted Al target distribution. This serves to eliminate beam-related noise.
- scale the Al distribution individually in each detector, such that the total number of gammas is equal to that of the target distribution.
- Correct Al for dead-time in the same way described in step 1.
- Scale cosmics distribution with the same scaling factors used for the Al distribution, and subtract the result from the Al distribution. This distribution should now contain only beam-related noise.
- Subtract cosmics distribution from target distribution.
- Divide by Cf252 distribution to get relative rate over theta_abs, in each detector.
Note: Cosmic noise from Cf252 distribution was less than 0.1% effect.
Final results
MCNP-POLIMI
Below is an MCNP-POLIMI simulation of a cylindrical D20 target (axis length = 2"; dia. = 0.75") subject to a bremsstrahlung photon beam with an end point of 10.5MeV. The plot below shows the relative distribution of neutron direction cosines w.r.t. the incident photon beam. All neutrons are from the photodisintegration of D20 and the direction cosine is taken as neutrons exit the target geometry.


