Difference between revisions of "Recreation of Plots Using GEMC 2.5"
| (5 intermediate revisions by the same user not shown) | |||
| Line 81: | Line 81: | ||
I haven't perfected setting stat box titles in my macro yet, but the order is that black is 0.0cm-0.2cm, then the stat boxes rotate around clockwise where magenta is 0.8cm-1.0cm. | I haven't perfected setting stat box titles in my macro yet, but the order is that black is 0.0cm-0.2cm, then the stat boxes rotate around clockwise where magenta is 0.8cm-1.0cm. | ||
| + | |||
| + | Despite my reconstruction failing from 0.4cm<Z<0.6cm, I tried to plot only that region and use the fit panel to restrict the region of interest for the fit. The plot is below | ||
| + | |||
| + | [[File:VzDiff R7 ModifiedFit.png|200px]] | ||
| + | |||
| + | Here sigma is 0.1861 +/- 0.0015, which agrees identically with Dr. Forest's result. Similarly, I can do the same with my first annular section (R1) and with any plot that does not initially agree to get different values that do agree. Using this modified fit method the following plot can be created | ||
| + | |||
| + | [[File:GEMC Results LBModifiedFit.png|200px]] | ||
| + | |||
| + | Now attempt to recreate the plot using a LUND file with phi equal to 90 degrees (0 degrees if defined in the gcard). | ||
| + | |||
| + | Here is the gcard I used | ||
| + | |||
| + | <gcard> | ||
| + | |||
| + | <detector name="../../../../../../clas12/fc/forwardCarriage" factory="TEXT" variation="original"/> | ||
| + | <detector name="../../../../../../clas12/dc/dc" factory="TEXT" variation="ccdb"/> | ||
| + | <detector name="../../../../../../clas12/ec/ec" factory="TEXT" variation="original"/> | ||
| + | <detector name="../../../../../../clas12/ctof/ctof" factory="TEXT" variation="original"/> | ||
| + | <detector name="../../../../../../clas12/ftof/ftof" factory="TEXT" variation="java"/> | ||
| + | <detector name="../../../../../../clas12/htcc/htcc" factory="TEXT" variation="original"/> | ||
| + | <detector name="../../../../../../clas12/magnets/solenoid" factory="TEXT" variation="original"/> | ||
| + | <detector name="../../../../../../clas12/pcal/pcal" factory="TEXT" variation="javageom"/> | ||
| + | <option name="SCALE_FIELD" value="clas12-torus-big, -1"/> | ||
| + | <option name="HALL_FIELD" value="clas12-solenoid"/> | ||
| + | <option name="OUTPUT" value="evio,eg12_sol_75k_1cm_DiskTarg_90DegRot_GEMC_2.5_10_26_16.ev"/> | ||
| + | |||
| + | <!-- <option name="BEAM_P" value="e-, 6.0*GeV, 25.0*deg, 0*deg"/>--> | ||
| + | <!-- <option name="SPREAD_V" value="(1.0,0.0)cm"/>--> | ||
| + | <option name="RANDOM" value="123483273456"/> | ||
| + | </gcard> | ||
| + | |||
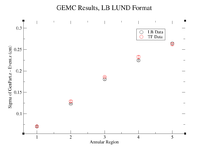
| + | The command lines for GEMC and CoatJava-2.4 are the same as above. Using the sample root commands and the fit modification within the canvas window to restrict the fit to exclude the tail end of the plot. Here is the xmgrace plot to show my data for the LUND file vs. Dr. Forest's | ||
| + | |||
| + | |||
| + | [[File:GEMC Results LUND Format.png|200px]] | ||
Latest revision as of 16:53, 3 November 2016
Here are the plots that I am trying to recreate
https://clasweb.jlab.org/wiki/index.php/File:EG12_SweetSpotVertex_ZdiffDist_10-6-16.png
using the commands
clas12->Draw("GenPart.z-Event.z >> R1(1000,-5,5)","abs(GenPart.x-Event.x)<1 && abs(GenPart.y-Event.y)<1 && sqrt(GenPart.x*GenPart.x+GenPart.y*GenPart.y)<0.2");
clas12->Draw("GenPart.z-Event.z >> R7(1000,-5,5)","abs(GenPart.x-Event.x)<1 && abs(GenPart.y-Event.y)<1 && sqrt(GenPart.x*GenPart.x+GenPart.y*GenPart.y)>0.6 && sqrt(GenPart.x*GenPart.x+GenPart.y*GenPart.y)<0.8");
Here is the gcard used
<gcard>
      <detector name="../../../../../../clas12/fc/forwardCarriage" factory="TEXT" variation="original"/>
      <detector name="../../../../../../clas12/dc/dc"            factory="TEXT" variation="ccdb"/>
      <detector name="../../../../../../clas12/ec/ec"            factory="TEXT" variation="original"/>
      <detector name="../../../../../../clas12/ctof/ctof"            factory="TEXT" variation="original"/>
      <detector name="../../../../../../clas12/ftof/ftof"            factory="TEXT" variation="java"/>
      <detector name="../../../../../../clas12/htcc/htcc"            factory="TEXT" variation="original"/>
      <detector name="../../../../../../clas12/magnets/solenoid" factory="TEXT" variation="original"/>
      <detector name="../../../../../../clas12/pcal/pcal"            factory="TEXT" variation="javageom"/>
      <option name="SCALE_FIELD" value="clas12-torus-big, -1"/>
      <option name="HALL_FIELD"  value="clas12-solenoid"/>
      <option name="OUTPUT" value="evio,eg12_sol_75k_1cm_DiskTarg_30DegRot_GEMC_2.5.ev"/>
       <option name="BEAM_P" value="e-, 6.0*GeV, 25.0*deg, 30*deg"/>
               <option name="SPREAD_V" value="(1.0,0.0)cm"/>
</gcard>
Here is the command line for GEMC:
~/src/CLAS/GEMC/2.0.Linux__Ubuntu16.04-x86_64-gcc5.4.0/gemc/2.5/gemc -USE_GUI=0 -N=75000 eg12.gcard
I used the same coatjava command (no fields) as seen below
~/src/CLAS/coatjava-2.4/bin/clas12-reconstruction -config GEOM::new=true -s DCHB:DCTB:EC:FTOF:EB -config DATA::mc=true -config DCTB::useRaster=true -i eg12_sol_75k_1cm_DiskTarg_30DegRot_GEMC_2.5.ev -o eg12_sol_75k_1cm_DiskTarg_30DegRot_GEMC_2.5_rec.evio
and finally the evio2root command line (done on lds2):
~/src/CLAS/evioRoot/bin/evio2root eg12_sol_75k_1cm_DiskTarg_30DegRot_GEMC_2.5_rec.evio eg12_sol_75k_1cm_DiskTarg_30DegRot_GEMC_2.5_rec.root 75000
For the plot below I required that Event.z is non-zero and that Event.z < 2cm.
Since these 2 plots were statistically different, I will try to use the same random number generator. Here is the gcard I used: <gcard>
      <detector name="../../../../../../clas12/fc/forwardCarriage" factory="TEXT" variation="original"/>
      <detector name="../../../../../../clas12/dc/dc"            factory="TEXT" variation="ccdb"/>
      <detector name="../../../../../../clas12/ec/ec"            factory="TEXT" variation="original"/>
      <detector name="../../../../../../clas12/ctof/ctof"            factory="TEXT" variation="original"/>
      <detector name="../../../../../../clas12/ftof/ftof"            factory="TEXT" variation="java"/>
      <detector name="../../../../../../clas12/htcc/htcc"            factory="TEXT" variation="original"/>
      <detector name="../../../../../../clas12/magnets/solenoid" factory="TEXT" variation="original"/>
      <detector name="../../../../../../clas12/pcal/pcal"            factory="TEXT" variation="javageom"/>
      <option name="SCALE_FIELD" value="clas12-torus-big, -1"/>
      <option name="HALL_FIELD"  value="clas12-solenoid"/>
      <option name="OUTPUT" value="evio,eg12_sol_75k_1cm_DiskTarg_30DegRot_GEMC_2.5_new.ev"/>
       <option name="BEAM_P" value="e-, 6.0*GeV, 25.0*deg, 0*deg"/>
       <option name="SPREAD_V" value="(1.0,0.0)cm"/>
<option name="RANDOM" value="123483273456"/>
</gcard>
Here is the GEMC command line:
~/src/CLAS/GEMC/2.0.Linux__Ubuntu16.04-x86_64-gcc5.4.0/gemc/2.5/gemc -USE_GUI=0 -N=75000 eg12_sol_1cm_DiskTarg.gcard
and the reconstruction line:
~/src/CLAS/coatjava-2.4/bin/clas12-reconstruction -config GEOM::new=true -s DCHB:DCTB:EC:FTOF:EB -config DATA::mc=true -config DCTB::useRaster=true -i eg12_sol_75k_1cm_DiskTarg_30DegRot_GEMC_2.5_new.ev -o eg12_sol_75k_1cm_DiskTarg_30DegRot_GEMC_2.5_rec_new.evio
Here are the histograms to be compared to mine created on 10/26/16
https://clasweb.jlab.org/wiki/index.php/File:EG12_SweetSpotVertex_ZdiffDist_10-26-16.png
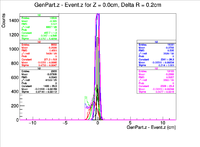
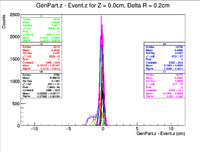
and here are the plots using the sample cuts above provided by Dr. Forest:
I haven't perfected setting stat box titles in my macro yet, but the order is that black is 0.0cm-0.2cm, then the stat boxes rotate around clockwise where magenta is 0.8cm-1.0cm.
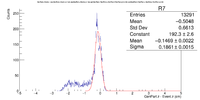
Despite my reconstruction failing from 0.4cm<Z<0.6cm, I tried to plot only that region and use the fit panel to restrict the region of interest for the fit. The plot is below
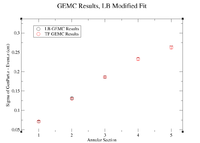
Here sigma is 0.1861 +/- 0.0015, which agrees identically with Dr. Forest's result. Similarly, I can do the same with my first annular section (R1) and with any plot that does not initially agree to get different values that do agree. Using this modified fit method the following plot can be created
Now attempt to recreate the plot using a LUND file with phi equal to 90 degrees (0 degrees if defined in the gcard).
Here is the gcard I used
<gcard>
      <detector name="../../../../../../clas12/fc/forwardCarriage" factory="TEXT" variation="original"/>
      <detector name="../../../../../../clas12/dc/dc"            factory="TEXT" variation="ccdb"/>
      <detector name="../../../../../../clas12/ec/ec"            factory="TEXT" variation="original"/>
      <detector name="../../../../../../clas12/ctof/ctof"            factory="TEXT" variation="original"/>
      <detector name="../../../../../../clas12/ftof/ftof"            factory="TEXT" variation="java"/>
      <detector name="../../../../../../clas12/htcc/htcc"            factory="TEXT" variation="original"/>
      <detector name="../../../../../../clas12/magnets/solenoid" factory="TEXT" variation="original"/>
      <detector name="../../../../../../clas12/pcal/pcal"            factory="TEXT" variation="javageom"/>
      <option name="SCALE_FIELD" value="clas12-torus-big, -1"/>
      <option name="HALL_FIELD"  value="clas12-solenoid"/>
      <option name="OUTPUT" value="evio,eg12_sol_75k_1cm_DiskTarg_90DegRot_GEMC_2.5_10_26_16.ev"/>
<option name="RANDOM" value="123483273456"/>
</gcard>
The command lines for GEMC and CoatJava-2.4 are the same as above. Using the sample root commands and the fit modification within the canvas window to restrict the fit to exclude the tail end of the plot. Here is the xmgrace plot to show my data for the LUND file vs. Dr. Forest's
