|
|
| Line 625: |
Line 625: |
| | |}<br> | | |}<br> |
| | | | |
| − | Here is the Radius vs Width plot for when abs(GenPart.z) <= 0.5cm along with a table of values.
| |
| − |
| |
| − | [[File:Radius vs Width Z=1 30DegRot.png|200px]]
| |
| − |
| |
| − | {|border="5"
| |
| − | |-
| |
| − | ||R (cm) || 0.1 || 0.2 || 0.3 || 0.4 ||0.5||0.6||0.7||0.8||0.9||1.0
| |
| − | |-
| |
| − | ||Width (cm) || 0.345 +/- 0.032 || 0.2889 +/- 0.0101 || 0.2704 +/- 0.0053 || || 0.2821 +/- 0.0042 || 0.2782 +/- 0.0035 || 0.287 +/- 0.003 || 0.294 +/- 0.003 || 0.294 +/- 0.003 || 0.2967 +/- 0.003
| |
| − | |-
| |
| − | |}<br>
| |
| − |
| |
| − | Here is the Radius vs Width plot for when abs(GenPart.z) <= 1.0 cm along with a table of values.
| |
| − |
| |
| − | [[File:Radius vs width z=2cm.png|200px]]
| |
| − |
| |
| − | {|border="5"
| |
| − | |-
| |
| − | ||R (cm) || 0.1 || 0.2 || 0.3 || 0.4 || 0.4 ||0.5||0.6||0.7||0.8||0.9||1.0
| |
| − | |-
| |
| − | ||Width (cm) || 0.5467 +/- 0.0351 || 0.4475 +/- 0.0102 || 0.4976 +/- 0.0084 || 0.505 +/- 0.006 || 0.4966 +/- 0.0055 || 0.4884 +/- 0.0045 || 0.502 +/- 0.004 || 0.5033 +/- 0.0038 || 0.4788 +/- 0.0029 || 0.4766 +/- 0.0026
| |
| − | |-
| |
| − | |}<br>
| |
| | | | |
| | | | |
Vertex Reconstruction studies
Inclusive electron GEMC 2.4 & Coatjava 2.4
LB_GEMC2.4CJ2.4_Vertex
Summary
Set all histogram ranges to -6,6 cm and bin sizes of 0.1 cm
Point target X,Y,Z=0 cm
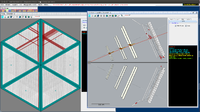
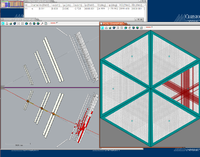
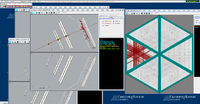
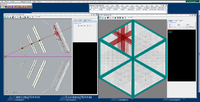
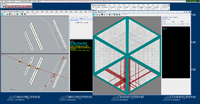
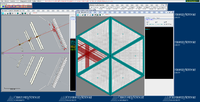
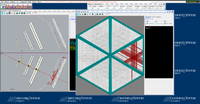
Below are examples of the reconstruction for several line targets as seen in the CED
We should change it to +30,150,210, and 330 degrees so the electron is not going in between two drift chambers but rather into the center, keep 90 and 270.
| 6cm Z Target, No Rotation |
6cm Z Target, 270 Degree Rotation |
6cm Z Target, 90 Degree Rotation |
2cm Y Target, 30 Degree Rotation |
2cm Y Target, 180 Degree Rotation |
2cm X Target, 90 Degree Rotation |
2cm X Target, 270 Degree Rotation
|
 |
 |
 |
 |
 |
 |
|
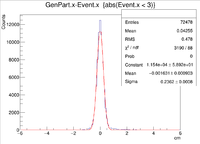
The histograms below are using a 6 GeV electron fired at an angles of 25 degrees in theta and 0 degrees in phi.
|
No Rastering
|
| Vx Difference |
|
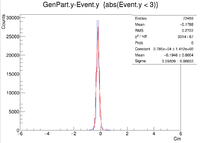
| Vy Difference |
|
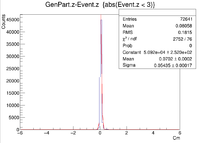
| Vz Difference |
|
| X Resolution (cm) |
0.2362 +/- 0.0008
|
| Y Resolution(cm) |
0.09809 +/- 0.00033
|
| Z Resolution (cm) |
0.05435 +/- 0.00017
|
These histograms raise some questions. To begin I created a LUND file with 6 GeV incident electrons at 25 degrees in theta and 0 degrees in phi. All of the vertex positions were set to 0. I then ran GEMC 2.4 using the command line
~/src/CLAS/GEMC/source/gemc -USE_GUI=0 -INPUT_GEN_FILE="LUND,No_Raster.LUND" -N=75000 eg12_sol_No_Raster.gcard
which created an output file called eg12_sol_75k_No_Raster.ev. After that the reconstruction command line used was
~/src/CLAS/coatjava-2.4/bin/clas12-reconstruction -i eg12_sol_75k_No_Raster.ev-config GEOM::new=true -config MAG::torus=-1.0 -config MAG::solenoid=1.0 -o eg12_sol_75k_No_Raster_rec.evio -s DCHB:DCTB:EC:FTOF:EB -config DATA::mc=true -config DCTB::useRaster=true
After the reconstruction a root file was created using
~/src/CLAS/evio2root/bin/evio2root eg12_sol_75k_No_Raster_rec.evio eg12_sol_75k_No_Raster_rec.root 75000
A plot was then created to show the X Vertex and Y Vertex Differences
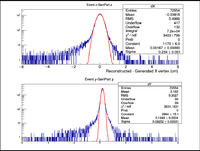
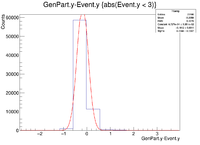
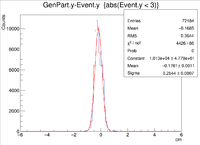
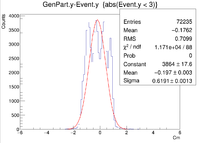
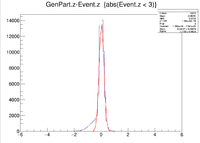
The first question is why is there a shift in the Y Difference. What would make X more centered around 0? The next question is when rastering begins, why do the resolutions in the X Vertices remain unchanged while the resolutions in the Y Vertices change?
Point in 2-D but extended target in 1-D
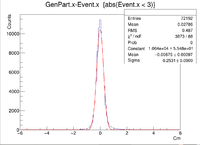
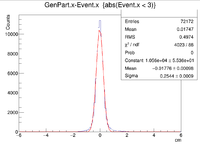
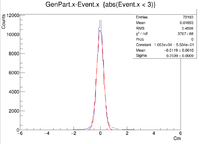
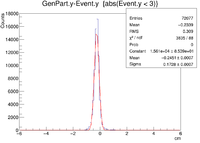
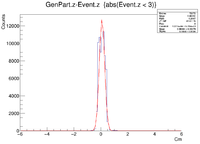
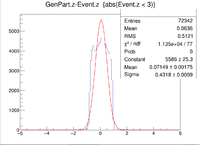
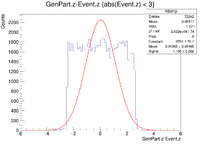
Two vertex variables are fixed at zero and the third vertex variable is altered. A 6 GeV electron was fired at angles of 25 degrees in theta and 0 degrees in phi.
|
2cm X Raster, Y=0,Z=0 |
2 cm Y Raster, X=0,Z=0 |
2 cm Z Raster ,X=0,Y=0 |
6 cm Z Raster ,X=0,Y=0
|
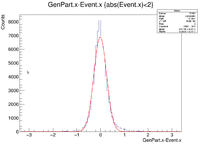
| Vx Difference |
 |
 |
 |
|
| Vy Difference |
 |
 |
 |
|
| Vz Difference |
 |
 |
 |
|
| X Resolution (cm) |
0.2658 +/- 0.0010 |
0.2531 +/- 0.0009 |
0.2544 +/- 0.0009 |
0.2539 +/- 0.0009
|
| Y Resolution(cm) |
0.1728 +/- 0.0007 |
0.2368 +/- 0.0007 |
0.2644 +/- 0.0007 |
0.6191 +/- 0.0013
|
| Z Resolution (cm) |
0.1792 +/- 0.0006 |
0.1998 +/- 0.0004 |
0.4318 +/- 0.0009 |
1.105 +/- 0.002
|
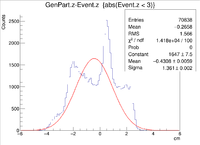
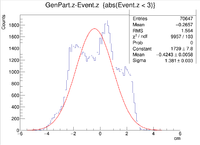
Extended target -3 < Z < 3 cm
|
1cm X Raster |
1 cm Y Raster |
1 cm X & Y Raster
|
| X Resolution (cm) |
0.2696 +/- 0.0009 |
0.2588 +/- 0.0009 |
0.2734 +/- 0.0009
|
| Y Resolution (cm) |
0.6234 +/- 0.0014 |
0.6851 +/- 0.0014 |
0.6927 +/- 0.0013
|
| Z Resolution (cm) |
1.136 +/- 0.002 |
1.361 +/- 0.002 |
1.381 +/- 0.003
|
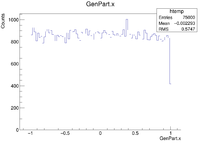
| Generated Vx (cm) |
 |
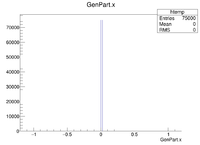 |
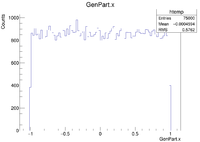
|
| Generated Vy (cm) |
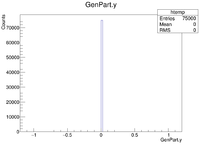 |
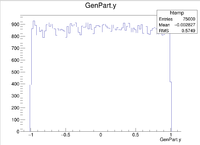 |
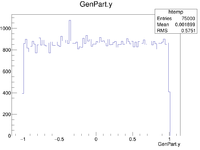
|
| Generated Vz (cm) |
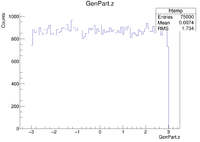 |
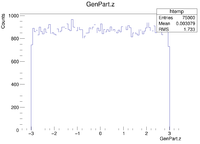 |
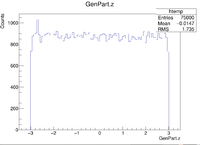
|
| Reconstructed Vx (cm) |
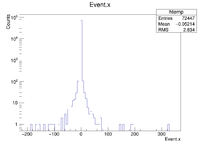 |
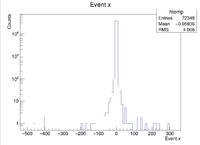 |
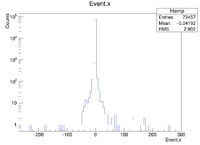
|
| Reconstructed Vy (cm) |
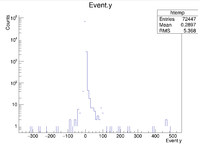 |
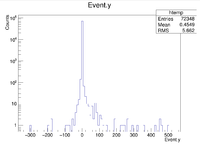 |
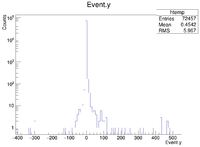
|
| Reconstructed Vz (cm) |
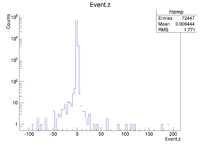 |
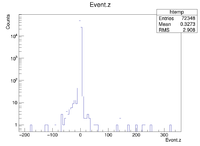 |
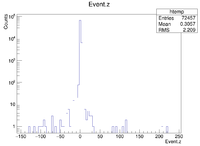
|
| Vx Difference (cm) |
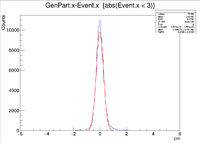 |
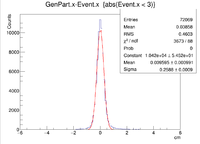 |
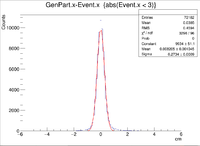
|
| Vy Difference (cm) |
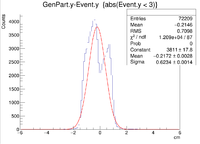 |
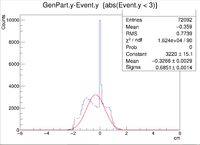 |
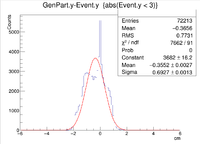
|
| Vz Difference (cm) |
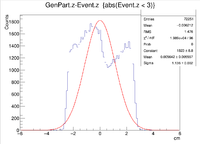 |
 |
|
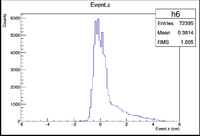
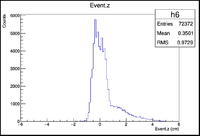
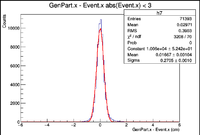
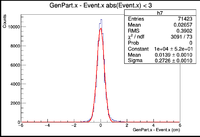
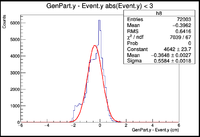
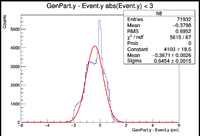
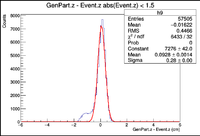
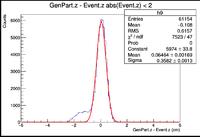
Extended target in Z. Vy shift analysis
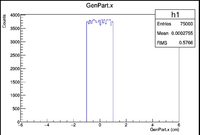
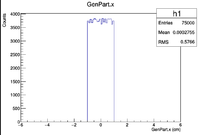
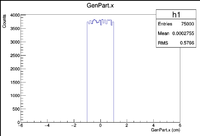
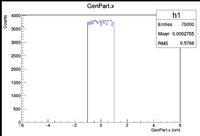
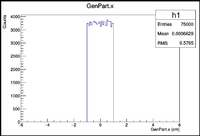
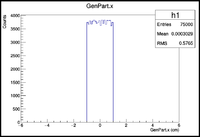
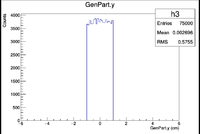
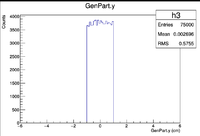
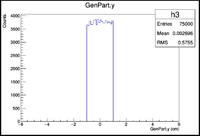
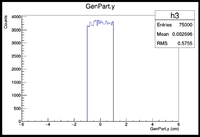
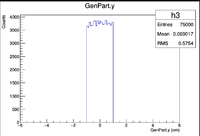
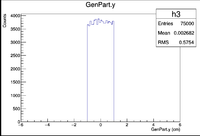
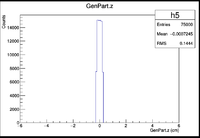
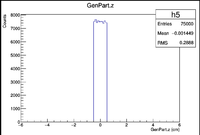
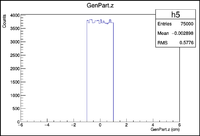
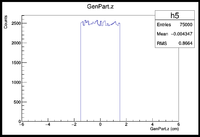
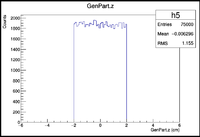
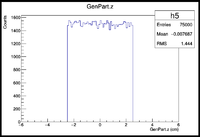
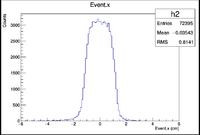
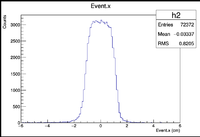
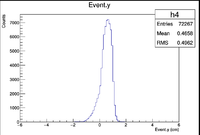
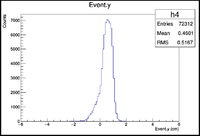
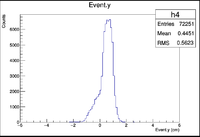
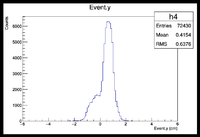
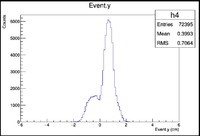
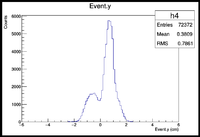
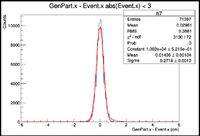
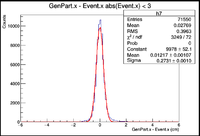
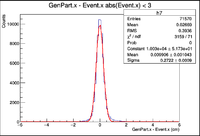
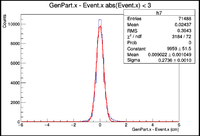
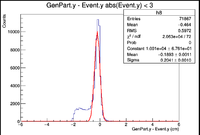
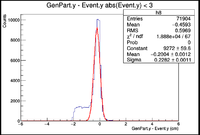
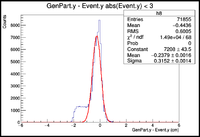
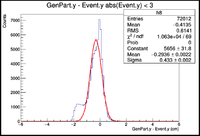
All Histograms below were created by simply making the target longer along the Z axis. Each case uses vertex points for X and Y ranging from -1cm to 1cm
|
0.5cm Z Target |
1cm Z Target |
2cm Z Target |
3cm Z Target |
4cm Z Target |
5cm Z Target
|
| X Resolution (cm) |
0.2705 +/- 0.0010 |
0.2726 +/- 0.0010 |
0.2716 +/- 0.0010 |
0.2731 +/- 0.0010 |
0.2702 +/- 0.0009 |
0.2736 +/- 0.0010
|
| Y Resolution (cm) |
0.2041 +/- 0.0010 |
0.2282 +/- 0.0011 |
0.3152 +/- 0.0014 |
0.433 +/- 0.002 |
0.5584 +/- 0.0018 |
0.6454 +/- 0.0015
|
| Z Resolution (cm) |
0.28 +/-0.00 |
0.3582 +/- 0.0013 |
0.5659 +/- 0.0018 |
0.7927 +/- 0.0023 |
1.034 +/- 0.003 |
1.253 +/-0.003
|
| X Mean (cm) |
0.0139 +/- 0.001 |
0.0139 +/- 0.00107 |
0.01436 +/- 0.00104 |
0.01217 +/- 0.00107 |
0.00991 +/- 0.00104 |
0.009022 +/- 0.00105
|
| Y Mean (cm) |
-0.1893 +/- 0.0011 |
-0.2004 +/- 0.0012 |
-0.2379 +/- 0.0016 |
-0.2936 +/- 0.0022 |
-0.3648 +/- 0.0027 |
-0.3871 +/- 0.0026
|
| Z Mean (cm) |
0.0928 +/- 0.0014 |
0.06464 +/- 0.0013 |
-0.0337 +/- 0.0028 |
-0.1582 +/- 0.0040 |
-0.3016 +/- 0.0053 |
-0.486 +/- 0.006
|
| Generated Vx (cm) |
 |
 |
 |
 |
 |
|
| Generated Vy (cm) |
 |
 |
 |
 |
 |
|
| Generated Vz (cm) |
 |
 |
 |
 |
 |
|
| Reconstructed Vx (cm) |
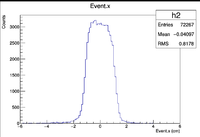 |
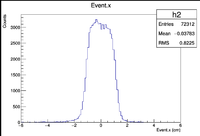 |
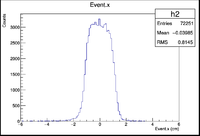 |
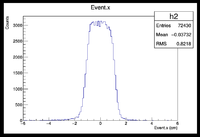 |
 |
|
| Reconstructed Vy (cm) |
 |
 |
 |
 |
 |
|
| Reconstructed Vz (cm) |
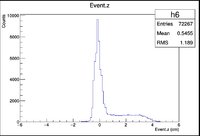 |
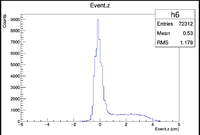 |
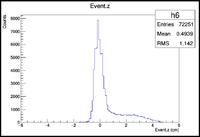 |
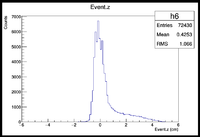 |
 |
|
| Vx Difference (cm) |
 |
 |
 |
 |
 |
|
| Vy Difference (cm) |
 |
 |
 |
 |
 |
|
| Vz Difference (cm) |
 |
 |
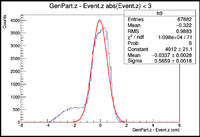 |
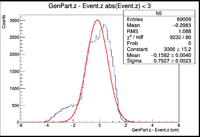 |
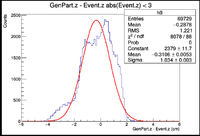 |
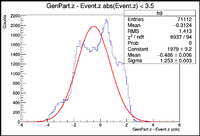
|
It would seem that increasing the length of the target in the Z direction has an effect on the resolution of the Y vertex position along with how far the center of the Gaussian peak will shift for the Y vertex differences.
Localized Vertex Resolution Investigation of Line Targets
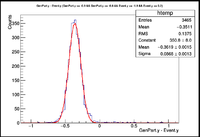
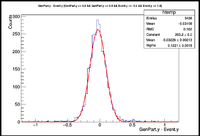
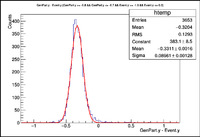
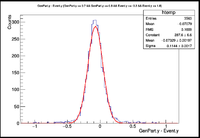
GEMC was ran to create electrons being produced in a line along certain axes. These include three separate 2cm targets centered at (0,0,0) in the X, Y , and Z directions. The final target is a line along the Z axis centered at (0,0,0) that is 6cm long. The generated electrons were shot at 25 degrees in theta and 0 degrees in phi at an energy of 6GeV.
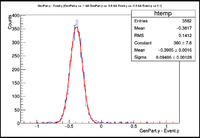
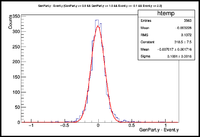
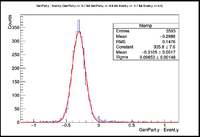
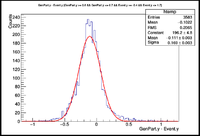
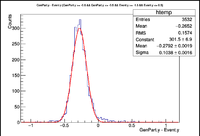
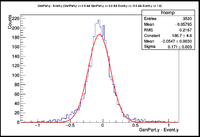
Here is an example of how the cuts were made. Consider the case of a 2cm line target in the Z direction centered at (0,0,0). Closed intervals begin at the end of the target and are 0.1cm long. So the first interval would be [-1.0,-0.9], then the next would be [-0.9, -0.8] and so on until the entire target is covered. The events in the EVENTHB bank were cut so that in any given interval there would be a margin of +/- 1cm to remove any outliers that may cause the histograms to have long tails.
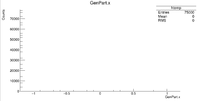
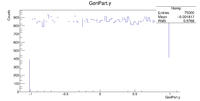
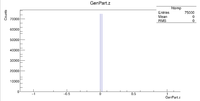
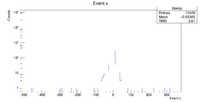
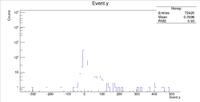
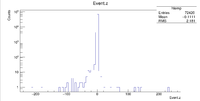
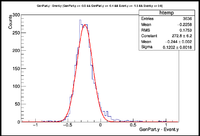
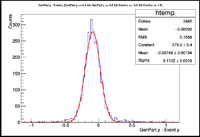
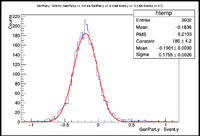
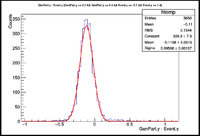
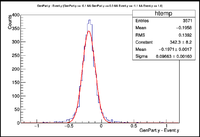
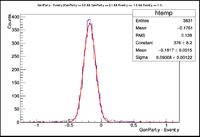
Below are the histograms for the 2cm line target in Y,X=0,Z=0. The electrons were fired with an energy of 6 GeV at 25 degrees in theta at 0 degrees in phi.
| GenPart.x |
GenPart.y |
GenPart.z |
Event.x |
Event.y |
Event.z
|
 |
 |
 |
 |
 |
|
| Interval |
Resolution (cm) |
Vy Difference |
*** |
Interval |
Resolution (cm) |
Vy Difference
|
| [-1.0,-0.9] |
0.09406 +/- 0.00128 |
 |
*** |
[0.9,1.0] |
0.1001 +/- 0.0016 |
|
| [-0.9,-0.8] |
0.0868 +/- 0.0013 |
 |
*** |
[0.8,0.9] |
0.1221 +/- 0.0018 |
|
| [-0.8,-0.7] |
0.08961 +/- 0.00128 |
 |
*** |
[0.7,0.8] |
0.1144 +/- 0.0017 |
|
| [-0.7,-0.6] |
0.09853 +/- 0.00148 |
 |
*** |
[0.6,0.7] |
0.169 +/- 0.003 |
|
| [-0.6,-0.5] |
0.1038 +/- 0.0016 |
 |
*** |
[0.5,0.6] |
0.171 +/- 0.003 |
|
| [-0.5,-0.4] |
0.1202 +/- 0.0018 |
 |
*** |
[0.4,0.5] |
0.1105 +/- 0.0016 |
|
| [-0.4,-0.3] |
0.1755 +/- 0.0026 |
 |
*** |
[0.3,0.4] |
0.09508 +/- 0.00137 |
|
| [-0.3,-0.2] |
0.1847 +/- 0.0028 |
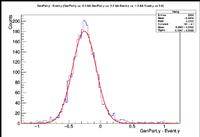 |
*** |
[0.2,0.3] |
0.09065 +/- 0.0140 |
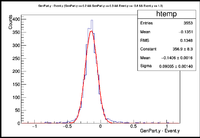
|
| [-0.2,-0.1] |
0.1255 +/- 0.0019 |
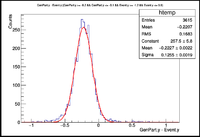 |
*** |
[0.1,0.2] |
0.093002 +/- 0.0013 |
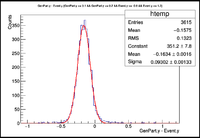
|
| [-0.1,0.0] |
0.09663 +/- 0.00160 |
 |
*** |
[0.0,0.1] |
0.09008 +/- 0.0012 |
|
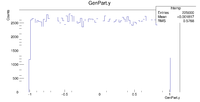
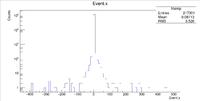
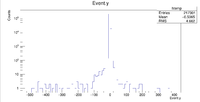
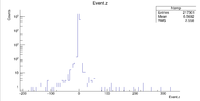
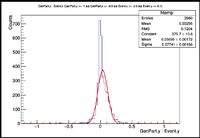
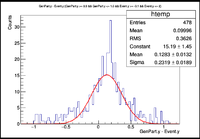
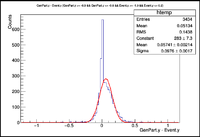
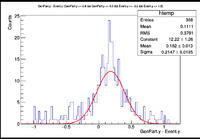
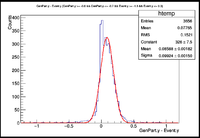
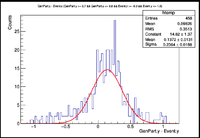
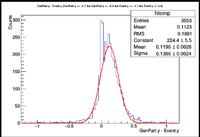
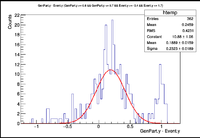
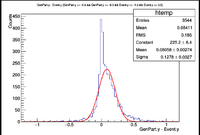
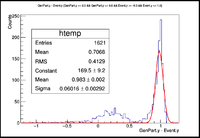
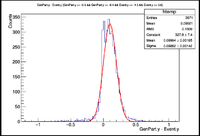
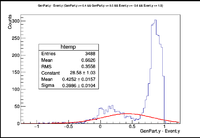
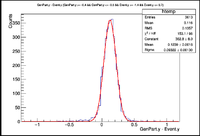
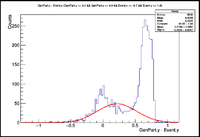
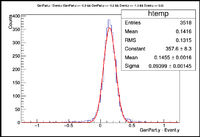
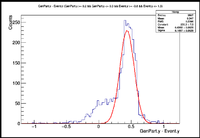
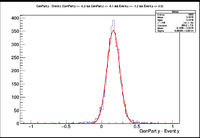
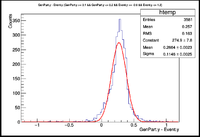
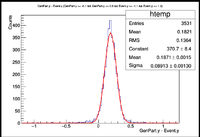
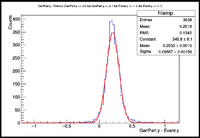
Below are the histograms for a 2cm target along the Y axis, X = 0 Z = 0. The electrons were fired with an energy of 6 GeV at 25 degrees in theta and 180 degrees in phi.
| GenPart.x |
GenPart.y |
GenPart.z |
Event.x |
Event.y |
Event.z
|
 |
 |
 |
 |
 |
|
| Interval |
Resolution (cm) |
Vy Difference |
*** |
Interval |
Resolution (cm) |
Vy Difference
|
| [-1.0,-0.9] |
0.07741 +/- 0.00166 |
 |
*** |
[0.9,1.0] |
0.2319 +/- 0.0189 |
|
| [-0.9,-0.8] |
0.0976 +/- 0.0017 |
 |
*** |
[0.8,0.9] |
0.2147 +/- 0.0185 |
|
| [-0.8,-0.7] |
0.09924 +/- 0.00150 |
 |
*** |
[0.7,0.8] |
0.2364 +/- 0.0188 |
|
| [-0.7,-0.6] |
0.1386 +/- 0.0024 |
 |
*** |
[0.6,0.7] |
0.2323 +/- 0.0189 |
|
| [-0.6,-0.5] |
0.1278 +/- 0.0027 |
 |
*** |
[0.5,0.6] |
0.06016 +/- 0.00299 |
|
| [-0.5,-0.4] |
0.09882 +/- 0.00142 |
 |
*** |
[0.4,0.5] |
0.3986 +/- 0.00104 |
|
| [-0.4,-0.3] |
0.09322 +/- 0.0013 |
 |
*** |
[0.3,0.4] |
0.3056 +/- 0.0047 |
|
| [-0.3,-0.2] |
0.09399 +/- 0.00145 |
 |
*** |
[0.2,0.3] |
0.1097 +/- 0.0029 |
|
| [-0.2,-0.1] |
0.08935 +/- 0.00131 |
 |
*** |
[0.1,0.2] |
0.1146 +/- 0.0025 |
|
| [-0.1,0.0] |
0.08913 +/- 0.00130 |
 |
*** |
[0.0,0.1] |
0.09557 +/- 0.0015 |
|
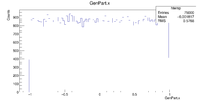
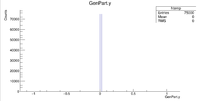
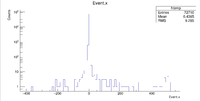
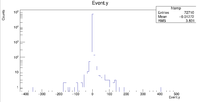
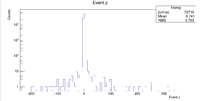
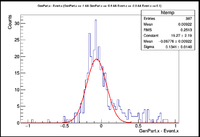
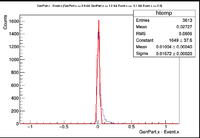
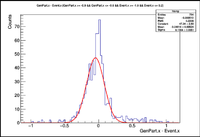
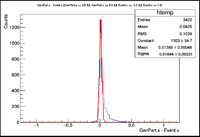
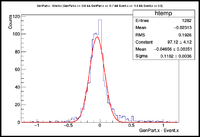
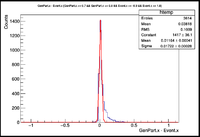
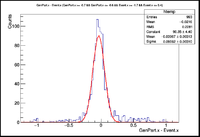
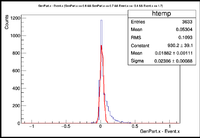
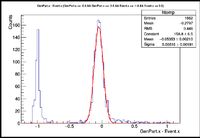
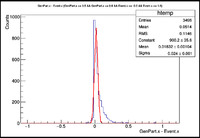
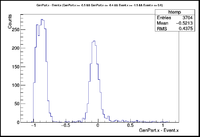
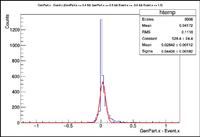
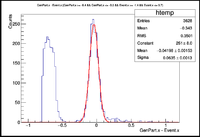
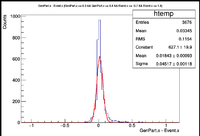
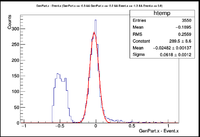
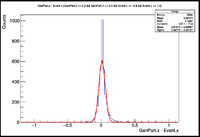
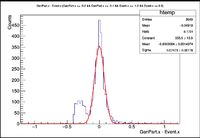
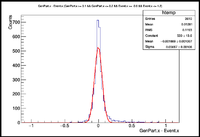
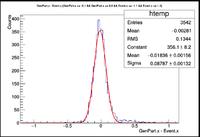
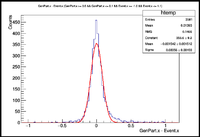
Below are the Histograms for a 2cm long target in the X Direction with a 6GeV electron fired at 25 degrees in theta and 90 degrees in phi
| GenPart.x |
GenPart.y |
GenPart.z |
Event.x |
Event.y |
Event.z
|
 |
 |
 |
 |
 |
|
| Interval |
Resolution (cm) |
Vx Difference |
*** |
Interval |
Resolution (cm) |
Vx Difference
|
| [-1.0,-0.9] |
0.1341 +/- 0.0140 |
 |
*** |
[0.9,1.0] |
0.01572 +/- 0.0002 |
|
| [-0.9,-0.8] |
0.1304 +/- 0.0051 |
 |
*** |
[0.8,0.9] |
0.01844 +/- 0.00031 |
|
| [-0.8,-0.7] |
0.1182 +/- 0.0036 |
 |
*** |
[0.7,0.8] |
0.01722 +/- 0.0028 |
|
| [-0.7,-0.6] |
0.09062 +/- 0.0031 |
 |
*** |
[0.6,0.7] |
0.02386 +/- 0.00088 |
|
| [-0.6,-0.5] |
0.06816 +/- 0.00191 |
 |
*** |
[0.5,0.6] |
0.024 +/- 0.001 |
|
| [-0.5,-0.4] |
n/a |
 |
*** |
[0.4,0.5] |
0.04406 +/- 0.00182 |
|
| [-0.4,-0.3] |
0.0635 +/- 0.0013 |
 |
*** |
[0.3,0.4] |
0.04517 +/- 0.00118 |
|
| [-0.3,-0.2] |
0.0618 +/- 0.0012 |
 |
*** |
[0.2,0.3] |
0.04722 +/- 0.00107 |
|
| [-0.2,-0.1] |
0.07473 +/- 0.00178 |
 |
*** |
[0.1,0.2] |
0.05667 +/- 0.00106 |
|
| [-0.1,0.0] |
0.08787 +/- 0.00132 |
 |
*** |
[0.0,0.1] |
0.08356 +/- 0.00159 |
|
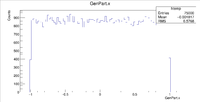
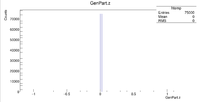
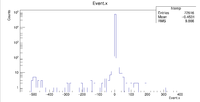
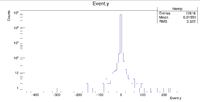
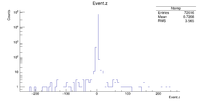
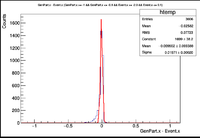
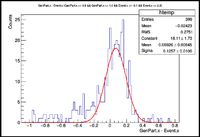
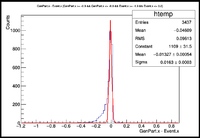
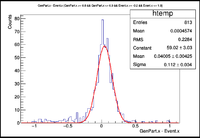
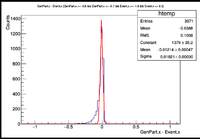
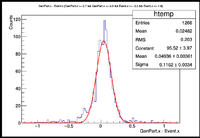
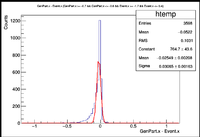
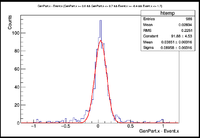
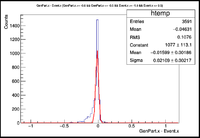
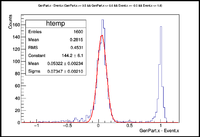
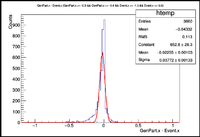
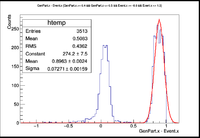
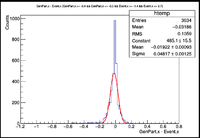
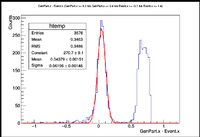
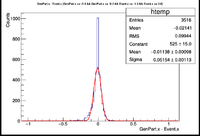
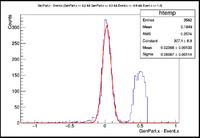
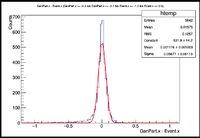
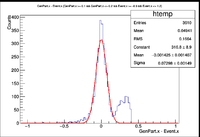
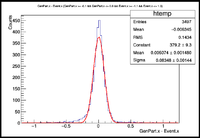
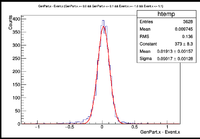
Below are the Vx Differences using a 2cm target in X with incident 6 GeV electrons at 25 degrees in theta and 270 degrees in phi
| GenPart.x |
GenPart.y |
GenPart.z |
Event.x |
Event.y |
Event.z
|
 |
 |
 |
 |
 |
|
| Interval |
Resolution (cm) |
Vx Difference |
*** |
Interval |
Resolution (cm) |
Vx Difference
|
| [-1.0,-0.9] |
0.01571 +/- 0.0002 |
 |
*** |
[0.9,1.0] |
0.1257 +/- 0.0100 |
|
| [-0.9,-0.8] |
0.0163 +/- 0.0003 |
 |
*** |
[0.8,0.9] |
0.112 +/- 0.004 |
|
| [-0.8,-0.7] |
0.01821 +/- 0.0003 |
 |
*** |
[0.7,0.8] |
0.1162 +/- 0.0034 |
|
| [-0.7,-0.6] |
0.03065 +/- .000163 |
 |
*** |
[0.6,0.7] |
0.08958 +/- 0.00316 |
|
| [-0.6,-0.5] |
0.02109 +/- 0.00217 |
 |
*** |
[0.5,0.6] |
0.07347 +/- 0.00210 |
|
| [-0.5,-0.4] |
0.03772 +/- 0.00133 |
 |
*** |
[0.4,0.5] |
0.07271 +/- 0.00159 |
|
| [-0.4,-0.3] |
0.04817 +/- 0.00125 |
 |
*** |
[0.3,0.4] |
0.06196 +/- 0.00146 |
|
| [-0.3,-0.2] |
0.05154 +/- 0.00113 |
 |
*** |
[0.2,0.3] |
0.06087 +/- 0.00114 |
|
| [-0.2,-0.1] |
0.05677 +/- 0.00106 |
 |
*** |
[0.1,0.2] |
0.07298 +/- 0.00149 |
|
| [-0.1,0.0] |
0.08348 +/- 0.00144 |
 |
*** |
[0.0,0.1] |
0.09017 +/- 0.00128 |
|
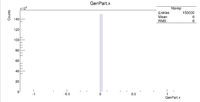
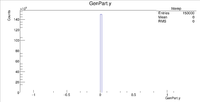
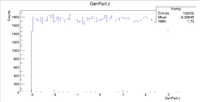
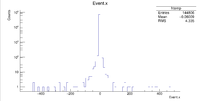
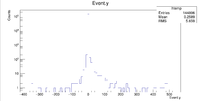
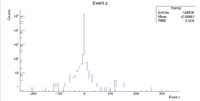
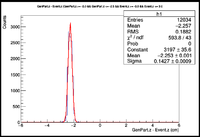
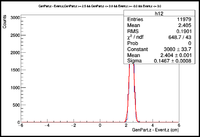
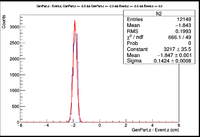
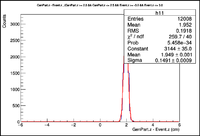
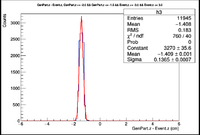
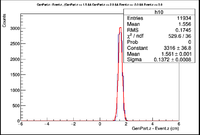
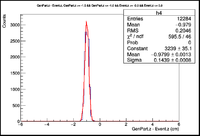
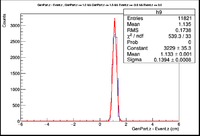
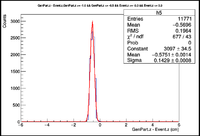
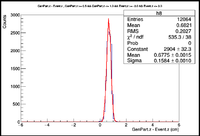
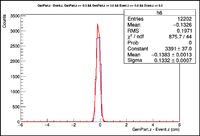
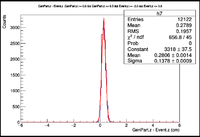
Below are the histograms for a 6cm target in the Z direction using a 6 GeV electron fired at 25 degrees in theta and 0 degrees in phi.
| GenPart.x |
GenPart.y |
GenPart.z |
Event.x |
Event.y |
Event.z
|
 |
 |
 |
 |
 |
|
| Interval |
Resolution (cm) |
Vz Difference |
*** |
Interval |
Resolution (cm) |
Vz Difference
|
| [-3.0,-2.5] |
0.1427 +/- 0.0009 |
 |
*** |
[2.5,3.0] |
0.1467 +/- 0.0008 |
|
| [-2.5,-2.0] |
0.1412 +/- 0.0008 |
 |
*** |
[2.0,2.5] |
0.1419 +/- 0.0009 |
|
| [-2.0,-1.5] |
0.1365 +/- 0.0007 |
 |
*** |
[1.5,2.0] |
0.1372 +/- 0.0008 |
|
| [-1.5,-1.0] |
0.1439 +/- 0.0008 |
 |
*** |
[1.0,1.5] |
0.1394 +/- 0.0008 |
|
| [-1.0,-0.5] |
0.1429 +/- 0.0008 |
 |
*** |
[0.5,1.0] |
0.1584 +/- 0.0010 |
|
| [-0.5,0.0] |
0.1332 +/- 0.0007 |
 |
*** |
[0.0,0.5] |
0.1378 +/- 0.0009 |
|
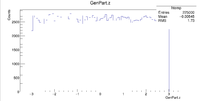
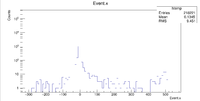
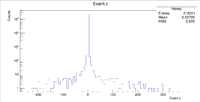
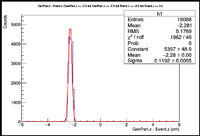
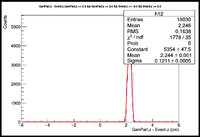
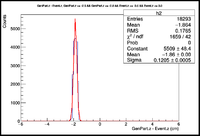
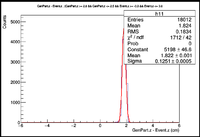
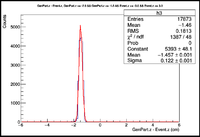
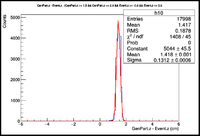
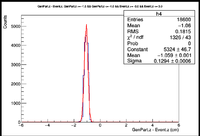
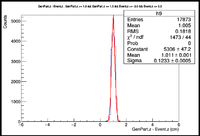
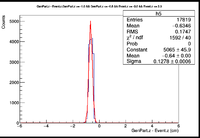
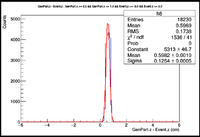
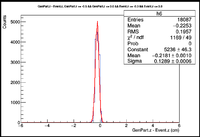
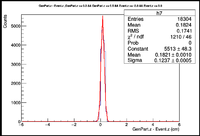
Below are the histograms for a 6cm target in the Z direction using a 6 GeV electron fired at 25 degrees in theta and 90 degrees in phi.
| GenPart.x |
GenPart.y |
GenPart.z |
Event.x |
Event.y |
Event.z
|
 |
 |
 |
 |
 |
|
| Interval |
Resolution (cm) |
Vz Difference |
*** |
Interval |
Resolution (cm) |
Vz Difference
|
| [-3.0,-2.5] |
0.1192 +/- 0.0005 |
 |
*** |
[2.5,3.0] |
0.1211 +/- 0.0005 |
|
| [-2.5,-2.0] |
0.1205 +/- 0.0005 |
 |
*** |
[2.0,2.5] |
0.1251 +/- 0.0005 |
|
| [-2.0,-1.5] |
0.122 +/- 0.001 |
 |
*** |
[1.5,2.0] |
0.1312 +/- 0.0006 |
|
| [-1.5,-1.0] |
0.1249 +/- 0.0006 |
 |
*** |
[1.0,1.5] |
0.1233 +/- 0.0005 |
|
| [-1.0,-0.5] |
0.1278 +/- 0.0006 |
 |
*** |
[0.5,1.0] |
0.1254 +/- 0.0005 |
|
| [-0.5,0.0] |
0.1289 +/- 0.0006 |
 |
*** |
[0.0,0.5] |
0.1237 +/- 0.0005 |
|
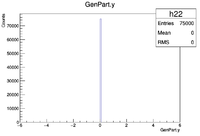
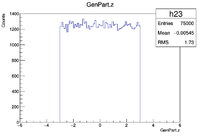
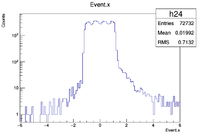
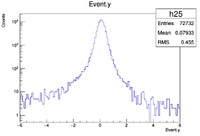
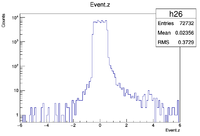
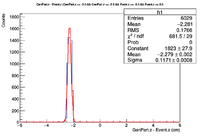
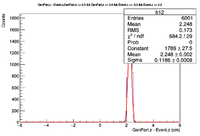
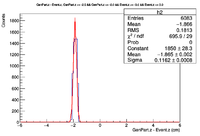
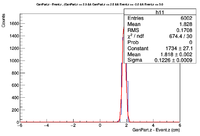
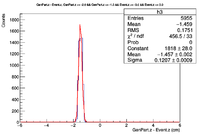
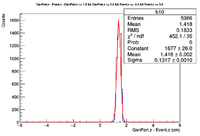
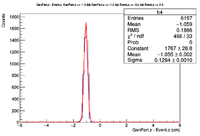
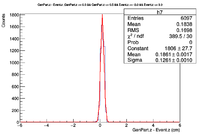
Below are the histograms for a 6 GeV electron fired at angles 25 degrees in theta and 270 degrees in phi. The target was 6cm in the Z direction.
| GenPart.x |
GenPart.y |
GenPart.z |
Event.x |
Event.y |
Event.z
|
 |
 |
 |
 |
 |
|
| Interval |
Resolution (cm) |
Vz Difference |
*** |
Interval |
Resolution (cm) |
Vz Difference
|
| [-3.0,-2.5] |
0.1171 +/- 0.0008 |
 |
*** |
[2.5,3.0] |
0.1186 +/- 0.0008 |
|
| [-2.5,-2.0] |
0.1162 +/- 0.0008 |
 |
*** |
[2.0,2.5] |
0.1226 +/- 0.0009 |
|
| [-2.0,-1.5] |
0.1207 +/- 0.0009 |
 |
*** |
[1.5,2.0] |
0.1317 +/- 0.0010 |
|
| [-1.5,-1.0] |
0.1294 +/- 0.0010 |
 |
*** |
[1.0,1.5] |
0.1239 +/- 0.0009 |
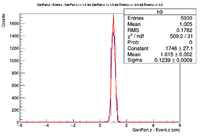
|
| [-1.0,-0.5] |
0.131 +/- 0.001 |
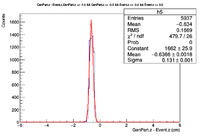 |
*** |
[0.5,1.0] |
0.1256 +/- 0.0009 |
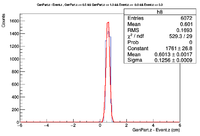
|
| [-0.5,0.0] |
0.131 +/- 0.001 |
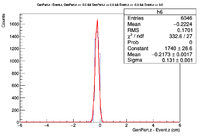 |
*** |
[0.0,0.5] |
0.1261 +/- 0.0010 |
|
Below are the histograms for a 6 GeV electron fired at 25 degrees in theta and 0 degrees in phi. The target is 2cm long on the Y axis.
| GenPart.x |
GenPart.y |
GenPart.z |
Event.x |
Event.y |
Event.z
|
 |
 |
 |
 |
 |

|
| Interval |
Resolution (cm) |
Vy Difference |
*** |
Interval |
Resolution (cm) |
Vy Difference
|
| [-1.0,-0.9] |
0.09406 +/- 0.00128 |
 |
*** |
[0.9,1.0] |
0.1001 +/- 0.0016 |

|
| [-0.9,-0.8] |
0.0868 +/- 0.0013 |
 |
*** |
[0.8,0.9] |
0.1221 +/- 0.0018 |

|
| [-0.8,-0.7] |
0.08961 +/- 0.00128 |
 |
*** |
[0.7,0.8] |
0.1144 +/- 0.0017 |

|
| [-0.7,-0.6] |
0.09853 +/- 0.00148 |
 |
*** |
[0.6,0.7] |
0.169 +/- 0.003 |

|
| [-0.6,-0.5] |
0.1038 +/- 0.0016 |
 |
*** |
[0.5,0.6] |
0.171 +/- 0.003 |

|
| [-0.5,-0.4] |
0.1202 +/- 0.0018 |
 |
*** |
[0.4,0.5] |
0.1105 +/- 0.0016 |

|
| [-0.4,-0.3] |
0.1755 +/- 0.0026 |
 |
*** |
[0.3,0.4] |
0.09508 +/- 0.00137 |

|
| [-0.3,-0.2] |
0.1847 +/- 0.0028 |
 |
*** |
[0.2,0.3] |
0.09065 +/- 0.0140 |

|
| [-0.2,-0.1] |
0.1255 +/- 0.0019 |
 |
*** |
[0.1,0.2] |
0.093002 +/- 0.0013 |

|
| [-0.1,0.0] |
0.09663 +/- 0.00160 |
 |
*** |
[0.0,0.1] |
0.09008 +/- 0.0012 |

|
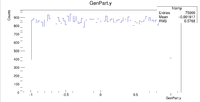
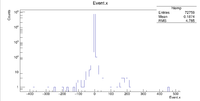
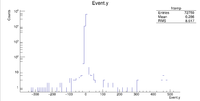
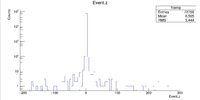
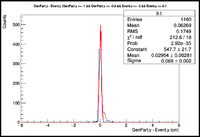
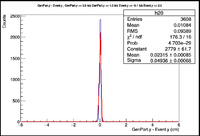
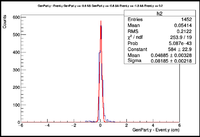
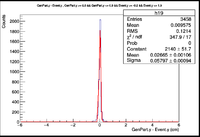
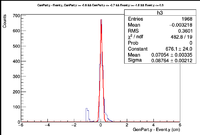
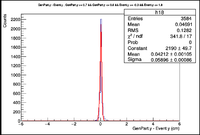
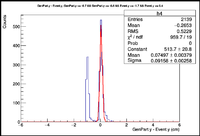
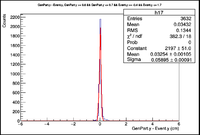
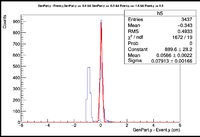
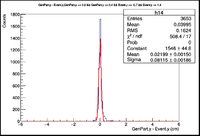
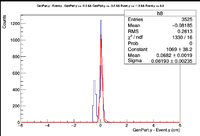
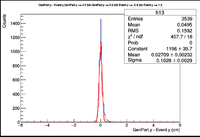
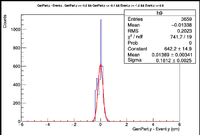
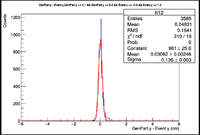
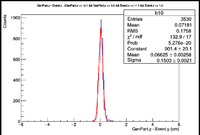
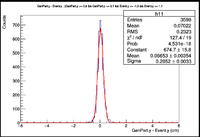
Below are the histograms for a 2cm target along the Y axis, X = 0 Z = 0. The electrons were fired with an energy of 6 GeV at 25 degrees in theta and 30 degrees in phi.
| GenPart.x |
GenPart.y |
GenPart.z |
Event.x |
Event.y |
Event.z
|
 |
 |
 |
 |
 |
|
| Interval |
Resolution (cm) |
Vy Difference |
*** |
Interval |
Resolution (cm) |
Vy Difference
|
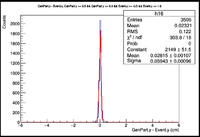
| [-1.0,-0.9] |
0.069 +/- 0.002 |
 |
*** |
[0.9,1.0] |
0.04936 +/- 0.00068 |
|
| [-0.9,-0.8] |
0.08185 +/- 0.00218 |
 |
*** |
[0.8,0.9] |
0.05797 +/- 0.00094 |
|
| [-0.8,-0.7] |
0.08764 +/- 0.00212 |
 |
*** |
[0.7,0.8] |
0.05896 +/- 0.00086 |
|
| [-0.7,-0.6] |
0.09158 +/- 0.00258 |
 |
*** |
[0.6,0.7] |
0.05895 +/- 0.00091 |
|
| [-0.6,-0.5] |
0.07913 +/- 0.00166 |
 |
*** |
[0.5,0.6] |
0.05943 +/- 0.00096 |
|
| [-0.5,-0.4] |
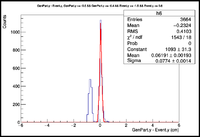
0.0774 +/- 0.0014 |
 |
*** |
[0.4,0.5] |
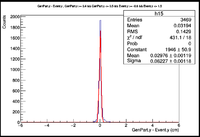
0.06227 +/- 0.00118 |
|
| [-0.4,-0.3] |
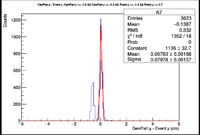
0.07978 +/- 0.00157 |
 |
*** |
[0.3,0.4] |
0.08115 +/- 0.00186 |
|
| [-0.3,-0.2] |
0.08193 +/- 0.00235 |
 |
*** |
[0.2,0.3] |
0.01028 +/- 0.0029 |
|
| [-0.2,-0.1] |
0.1812 +/- 0.0025 |
 |
*** |
[0.1,0.2] |
0.136 +/- 0.003 |
|
| [-0.1,0.0] |
0.1503 +/- 0.0021 |
 |
*** |
[0.0,0.1] |
0.2052 +/- 0.0033 |
|
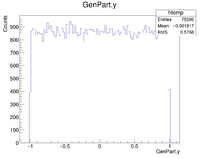
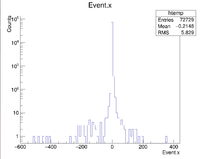
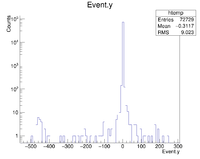
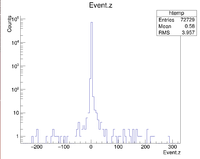
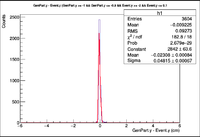
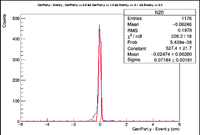
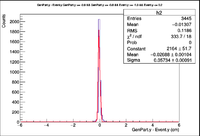
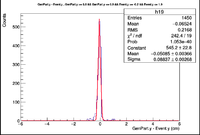
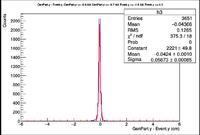
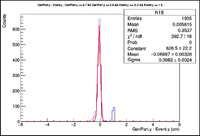
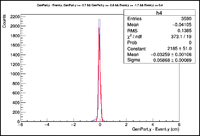
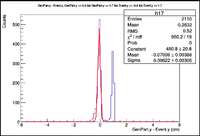
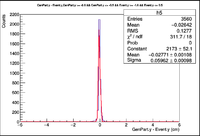
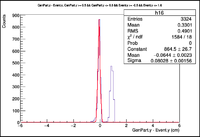
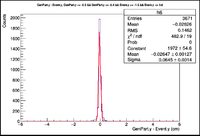
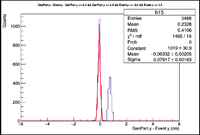
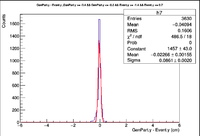
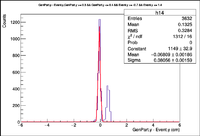
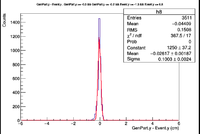
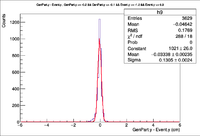
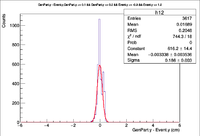
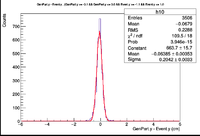
Below are the histograms for a 2cm Y target with an incident electron energy of 6 GeV. The angles were theta = 25 degrees and phi = 210 degrees
| GenPart.x |
GenPart.y |
GenPart.z |
Event.x |
Event.y |
Event.z
|
 |
 |
 |
 |
 |
|
| Interval |
Resolution (cm) |
Vy Difference |
*** |
Interval |
Resolution (cm) |
Vy Difference
|
| [-1.0,-0.9] |
0.04815 +/- 0.00067 |
 |
*** |
[0.9,1.0] |
0.07184 +/- 0.00181 |
|
| [-0.9,-0.8] |
0.05734 +/- 0.00091 |
 |
*** |
[0.8,0.9] |
0.08837 +/- 0.00268 |
|
| [-0.8,-0.7] |
0.05873 +/- 0.00085 |
 |
*** |
[0.7,0.8] |
0.0982 +/- 0.0024 |
|
| [-0.7,-0.6] |
0.05868 +/- 0.00089 |
 |
*** |
[0.6,0.7] |
0.09622 +/- 0.00305 |
|
| [-0.6,-0.5] |
0.05962 +/- 0.00098 |
 |
*** |
[0.5,0.6] |
0.08028 +/- 0.00156 |
|
| [-0.5,-0.4] |
0.0645 +/- 0.0014 |
 |
*** |
[0.4,0.5] |
0.07917 +/- 0.00163 |
|
| [-0.4,-0.3] |
0.0861 +/- 0.0020 |
 |
*** |
[0.3,0.4] |
0.08056 +/- 0.00159 |
|
| [-0.3,-0.2] |
0.1003 +/- 0.0024 |
 |
*** |
[0.2,0.3] |
0.08939 +/- 0.00201 |
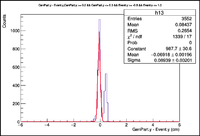
|
| [-0.2,-0.1] |
0.1305 +/- 0.0024 |
 |
*** |
[0.1,0.2] |
0.186 +/- 0.003 |
|
| [-0.1,0.0] |
0.2042 +/- 0.0033 |
 |
*** |
[0.0,0.1] |
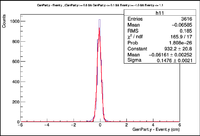
0.1476 +/- 0.0021 |
|
Localized Vertex Resolution Investigation of 2 Dimensional Targets
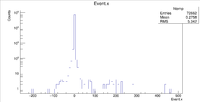
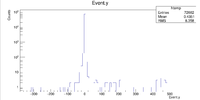
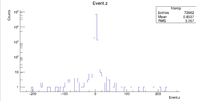
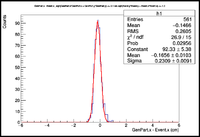
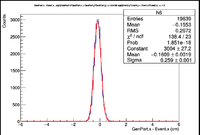
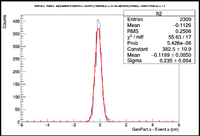
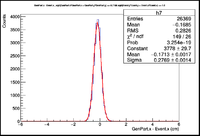
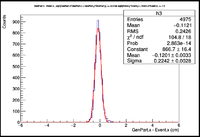
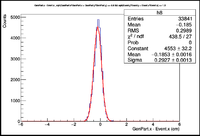
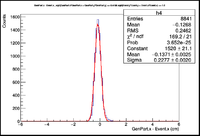
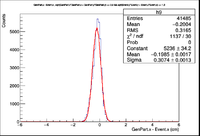
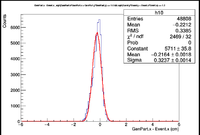
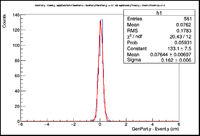
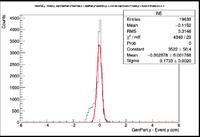
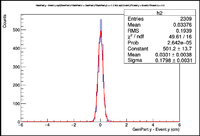
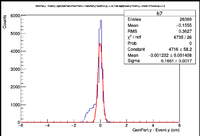
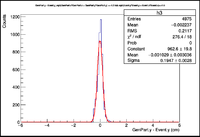
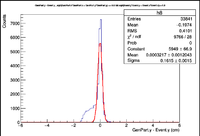
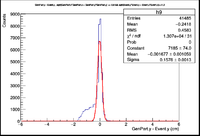
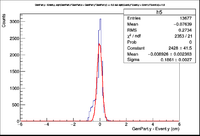
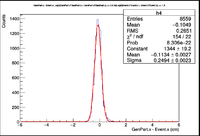
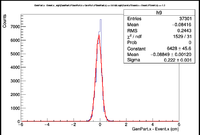
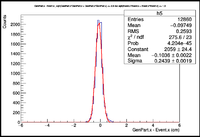
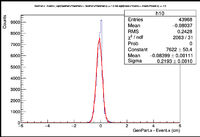
The histograms below were created using a 6 GeV electron fired at 25 degrees in theta and 30 degrees in phi. To make the cuts I simply made circles of increasing radius centered at the origin. I used 0.1cm increments to make the 10 histograms for each vertex position.
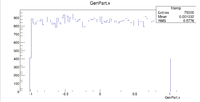
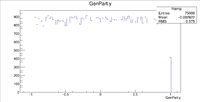
Below are the Vx and Vy Differences for a 2cm XY target, Z=0.
| GenPart.x |
GenPart.y |
GenPart.z |
Event.x |
Event.y |
Event.z
|
 |
 |
 |
 |
 |
|
| Radius (cm) |
Resolution (cm) |
Vx Difference |
*** |
Radius (cm) |
Resolution (cm) |
Vx Difference
|
| 0.1 |
0.2309 +/- 0.0091 |
 |
*** |
0.6 |
0.259 +/- 0.001 |
|
| 0.2 |
0.235 +/- 0.004 |
 |
*** |
0.7 |
0.2769 +/- 0.0014 |
|
| 0.3 |
0.2242 +/- 0.0028 |
 |
*** |
0.8 |
0.2927 +/- 0.0013 |
|
| 0.4 |
0.2272 +/- 0.0020 |
 |
*** |
0.9 |
0.3074 +/- 0.0013 |
|
| 0.5 |
0.2422 +/- 0.0016 |
 |
*** |
1.0 |
0.3237 +/- 0.0014 |
|
| Radius (cm) |
Resolution (cm) |
VyDifference |
*** |
Radius (cm) |
Resolution (cm) |
Vy Difference
|
| 0.1 |
0.162 +/- 0.006 |
 |
*** |
0.6 |
0.1733 +/- 0.0020 |
|
| 0.2 |
0.1798 +/- 0.0031 |
 |
*** |
0.7 |
0.1661 +/- 0.0017 |
|
| 0.3 |
0.1947 +/- 0.0028 |
 |
*** |
0.8 |
0.1615 +/- 0.0015 |
|
| 0.4 |
0.1959 +/- 0.0033 |
 |
*** |
0.9 |
0.1578 +/- 0.0013 |
|
| 0.5 |
0.1861 +/- 0.0027 |
 |
*** |
1.0 |
0.4832 +/- 0.0035 |
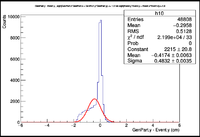
|
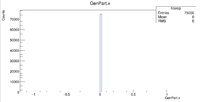
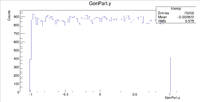
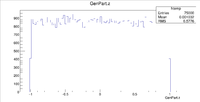
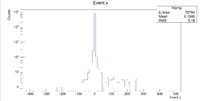
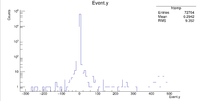
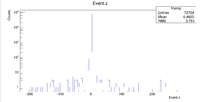
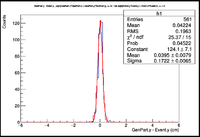
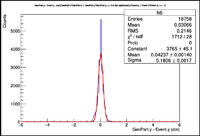
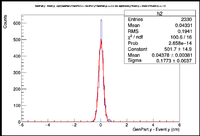
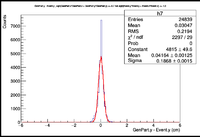
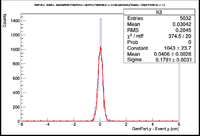
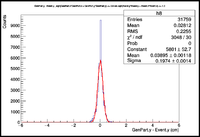
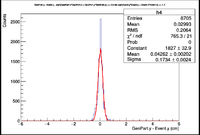
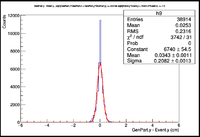
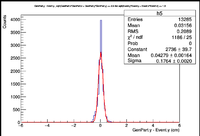
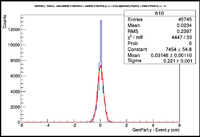
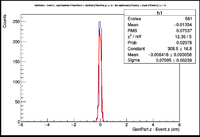
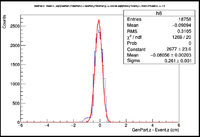
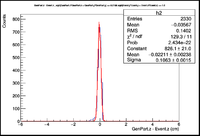
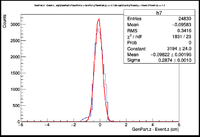
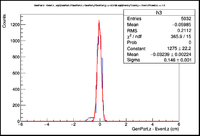
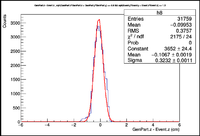
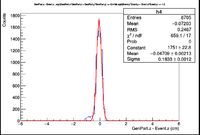
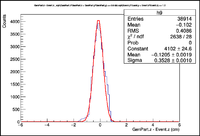
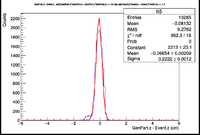
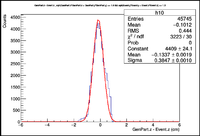
Below are the Vy and Vz differences for a 2cm target in Y and Z, X=0. The electrons were fired with an energy of 6 GeV and angles of 25 degrees in theta and 30 degrees in phi.
| GenPart.x |
GenPart.y |
GenPart.z |
Event.x |
Event.y |
Event.z
|
 |
 |
 |
 |
 |
|
| Radius (cm) |
Resolution (cm) |
Vy Difference |
*** |
Radius (cm) |
Resolution (cm) |
Vy Difference
|
| 0.1 |
0.1722 +/- 0.0065 |
 |
*** |
0.6 |
0.1806 +/- 0.0017 |
|
| 0.2 |
0.1773 +/- 0.0037 |
 |
*** |
0.7 |
0.1868 +/- 0.0015 |
|
| 0.3 |
0.1781 +/- 0.0031 |
 |
*** |
0.8 |
0.1974 +/- 0.0014 |
|
| 0.4 |
0.1734 +/- 0.0024 |
 |
*** |
0.9 |
0.2028 +/- 0.0013 |
|
| 0.5 |
0.1764 +/- 0.0020 |
 |
*** |
1.0 |
0.221 +/- 0.001 |
|
| Radius (cm) |
Resolution (cm) |
Vz Difference |
*** |
Radius (cm) |
Resolution (cm) |
Vz Difference
|
| 0.1 |
0.07095 +/- 0.00239 |
 |
*** |
0.6 |
0.261 +/- 0.001 |
|
| 0.2 |
0.1063 +/- 0.0015 |
 |
*** |
0.7 |
0.2874 +/- 0.0010 |
|
| 0.3 |
0.146 +/- 0.001 |
 |
*** |
0.8 |
0.3232 +/- 0.0011 |
|
| 0.4 |
0.1833 +/- 0.0012 |
 |
*** |
0.9 |
0.3528 +/- 0.0010 |
|
| 0.5 |
0.2222 +/- 0.0012 |
 |
*** |
1.0 |
0.3847 +/- 0.0010 |
|
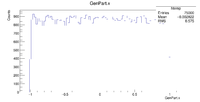
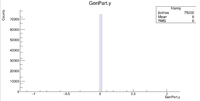
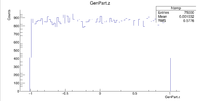
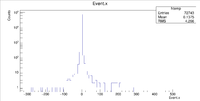
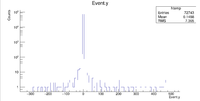
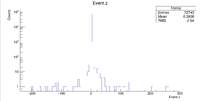
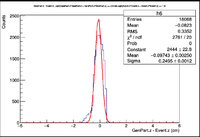
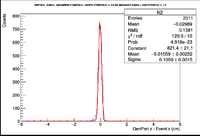
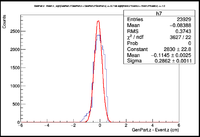
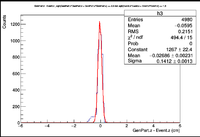
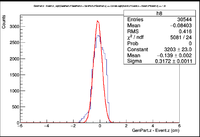
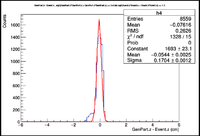
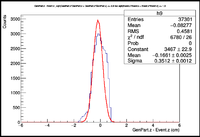
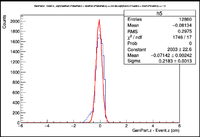
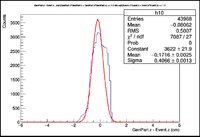
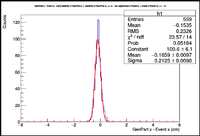
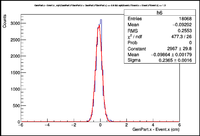
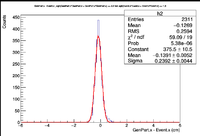
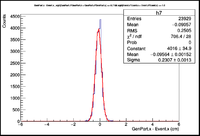
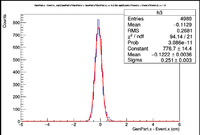
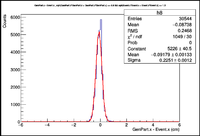
Below are the Vx and Vz differences for a 2cm XZ target, Y = 0. The electrons were fired with an energy of 6 GeV at angles theta = 25 degrees and phi = 30 degrees.
| GenPart.x |
GenPart.y |
GenPart.z |
Event.x |
Event.y |
Event.z
|
 |
 |
 |
 |
 |
|
| Radius (cm) |
Resolution (cm) |
Vz Difference |
*** |
Radius (cm) |
Resolution (cm) |
Vz Difference
|
| 0.1 |
0.06193 +/- 0.00199 |
 |
*** |
0.6 |
0.2495 +/- 0.0012 |
|
| 0.2 |
0.1059 +/- 0.0015 |
 |
*** |
0.7 |
0.2862 +/- 0.0011 |
|
| 0.3 |
0.1412 +/- 0.0013 |
 |
*** |
0.8 |
0.3172 +/- 0.001 |
|
| 0.4 |
0.1704 +/- 0.0012 |
 |
*** |
0.9 |
0.3512 +/- 0.0012 |
|
| 0.5 |
0.2183 +/- 0.0013 |
 |
*** |
1.0 |
0.4066 +/- 0.0013 |
|
| Radius (cm) |
Resolution (cm) |
Vx Difference |
*** |
Radius (cm) |
Resolution (cm) |
Vx Difference
|
| 0.1 |
0.2125 +/- 0.0090 |
 |
*** |
0.6 |
0.2365 +/- 0.0016 |
|
| 0.2 |
0.2392 +/- 0.0044 |
 |
*** |
0.7 |
0.2307 +/- 0.0013 |
|
| 0.3 |
0.251 +/- 0.003 |
 |
*** |
0.8 |
0.2251 +/- 0.0012 |
|
| 0.4 |
0.2494 +/- 0.0023 |
 |
*** |
0.9 |
0.222 +/- 0.001 |
|
| 0.5 |
0.2439 +/- 0.0019 |
 |
*** |
1.0 |
0.2193 +/- 0.0010 |
|
Localized Vertex Resolution of 3 Dimensional targets
For the plots below, a 6 GeV electron was fired at angles 25 degrees in theta and 30 degrees in phi. The target has an XY radius of 1cm and a length in the Z direction of 6cm. Setting GenPart.z = 0cm, the resolution was investigated as a function of the target's XY radius along with a table for the values.
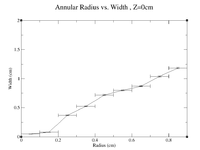
clas12->Draw("Event.z >> (100,-5,5)","sqrt(GenPart.x*GenPart.x+GenPart.y*GenPart.y)<0.95 && sqrt(GenPart.x*GenPart.x+GenPart.y*GenPart.y)>0.85");
| R (cm) |
0.05 +/- 0.05 |
0.15 +/- 0.05 |
0.25 +/- 0.05 |
0.35 +/- 0.05 |
0.45 +/- 0.05 |
0.55 +/- 0.05 |
0.65 +/- 0.05 |
0.75 +/- 0.05 |
0.85 +/- 0.05 |
0.95 +/- 0.05
|
| Width (cm) |
0.05094 +/- 0.0019 |
0.07812 +/- 0.0018 |
0.3688 +/- 0.0063 |
0.5231 +/- 0.0077 |
0.718 +/- 0.012 |
0.7987 +/- 0.0092 |
0.8709 +/- 0.0085 |
1.038 +/- 0.01 |
1.183 +/- 0.012 |
1.296 +/- 0.013
|
For this section I created a target that is 2cm in X and Y, and 6cm in Z. To produce the histograms I made a cut in the radius of a cylinder (R=0.1cm, R=0.2cm, .... , R=1.0cm) and also cut Z (Z=1cm, Z=2cm,...,Z=6cm) so that for each fixed radius there will be 6 histograms corresponding to changes in Z. For example, assume I am using R=0.1cm. There will be 6 histograms for X,Y,and Z corresponding to changing Z from 1cm to 6cm in 1cm increments. I also placed a cut for the reconstructed events using the commands abs(Event.z) <= 4.0 and sqrt(Event.x*Event.x+Event.y*Event.y) <=1.
For the plots below, a 6 GeV electron was fired at angles 25 degrees in theta and 30 degrees in phi. The target has an XY radius of 1cm and a length in the Z direction of 6cm. Setting GenPart.z = 0cm, the resolution was investigated as a function of the target's XY radius along with a table for the values.
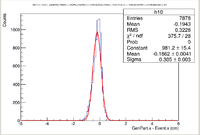
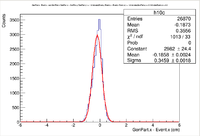
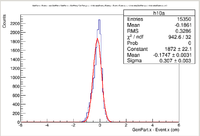
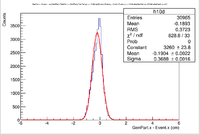
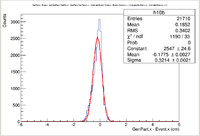
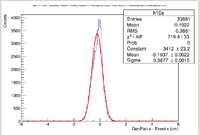
Below are the Vx Differences for R=1.0cm as an example.
| Z (cm) |
Resolution (cm) |
Vx Difference |
*** |
Z (cm) |
Resolution (cm) |
Vx Difference
|
| 1.0 |
0.305 +/- 0.003 |
 |
*** |
4.0 |
0.3459 +/- 0.0018 |
|
| 2.0 |
0.307 +/- 0.003 |
 |
*** |
5.0 |
0.3688 +/- 0.0016 |
|
| 3.0 |
0.3214 +/- 0.0021 |
 |
*** |
6.0 |
0.3877 +/- 0.0015 |
|
Elastic electron proton GEMC 2.4 & Coatjava 2.4
References
https://clasweb.jlab.org/wiki/index.php/TF_EG12_Vertex#Z_resolution_With_micro-megas
EG12#Vertex_Studies


