|
|
| (14 intermediate revisions by the same user not shown) |
| Line 1: |
Line 1: |
| − | =Initial rate study=
| + | Niowave Positron Project Progress for October 2015 |
| | | | |
| − | 2mm thick PbBi, 10 MeV, 1 cm cylindrical incident electron distribution
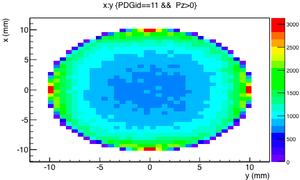
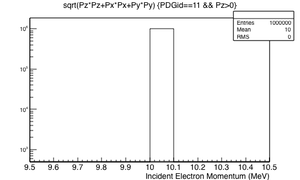
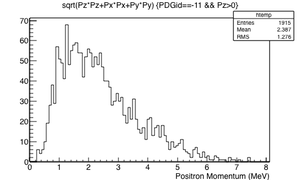
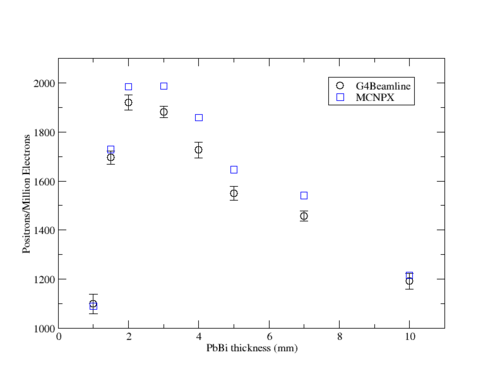
| + | A comparison was made between MCNPX and GEANT4 using a cylindrical electron beam with a radius of 1 cm. The 10 MeV incident electrons impinged a 2 mm thick PbBi target. Positrons escape the surface of the PbBi target with a mean momentum of 2.3 MeV. The positron production efficiency predictions from MCNPX and GEANT4 are within uncertainties. |
| − | | + | |
| − | G4beamline pencil beam 10 cm radius
| |
| − | <pre>
| |
| − | beam ellipse particle=e- nEvents=1000000 beamZ=0.0 beamX=0. beamY=0. \
| |
| − | sigmaX=10.0 sigmaY=10.0 sigmaXp=0.000 sigmaYp=0.000 \
| |
| − | meanMomentum=10. sigmaE=0. maxR=10.
| |
| − | </pre>
| |
| | | | |
| | Incident Electron spatial distribution and energy | | Incident Electron spatial distribution and energy |
| | | | |
| − | [[File:PbBi_5-1-15_X-Yposition.png | 200 px]][[File:PbBi_5-1-15_Ein.png | 200 px]] | + | [[File:PbBi_5-1-15_X-Yposition.png | 300 px]][[File:PbBi_5-1-15_Ein.png | 300 px]] |
| | | | |
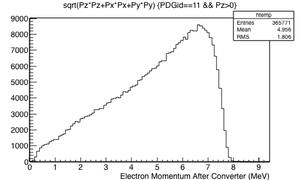
| | Positron and Electron Momentum after the converter | | Positron and Electron Momentum after the converter |
| | | | |
| − | [[File:PbBi_5-1-15_Ppositron.png | 200 px]][[File:PbBi_5-1-15_Pelectron.png | 200 px]] | + | [[File:PbBi_5-1-15_Ppositron.png | 300 px]][[File:PbBi_5-1-15_Pelectron.png | 300 px]] |
| − | | |
| − | {| border="1"
| |
| − | | PbBi Thickness (mm) || #positrons/million electrons (G4Beamline)|| #positrons/million electrons (MCNPX)
| |
| − | |-
| |
| − | | 1 || 1169,1083,1068,1090,1088 =1100<math>\pm</math> 40|| 1091
| |
| − | |-
| |
| − | | 1.5 || 1723, 1668,1671, 1687,1726=1695<math>\pm</math> 28 || 1728
| |
| − | |-
| |
| − | | 2 || 1902,1921,1886,1967,1922=1920<math>\pm</math> 30 || 1984
| |
| − | |-
| |
| − | | 3|| 1920,1880,1883,1864,1857=1881 <math>\pm</math> 24|| 1986
| |
| − | |-
| |
| − | | 4||1688, 1766, 1712, 1709, 1753=1726<math>\pm</math> 33 || 1858
| |
| − | |-
| |
| − | | 5|| 1569,1585,1509 ,1536,1551=1550<math>\pm</math> 29 || 1646
| |
| − | |-
| |
| − | | 7|| 1475,1450,1457,1428,1477 =1457<math> \pm</math> 20 || 1541
| |
| − | |-
| |
| − | | 10|| 1250,1180,1178,1186,1166=1192<math>\pm</math> 33|| 1216
| |
| − | |-
| |
| − | |}
| |
| − | | |
| − | [[File:G4Bl-vs-MCNPX_5-5-2015.png| 200 px]]
| |
| − | | |
| − | Dmitry's processing of Tony's GEANT simulations showing transverse phase space portrait (left) and longitudinal phase space portrait (right). Phase space portraits show coordinate x or y vs
| |
| − | diveregense=px/pz or py/pz (or time vs kinetic energy ). Captions show:
| |
| − | | |
| − | 1. geometric (not normalized) emittance for transverse and emittance for longitudinal phase space portraits (ellipse areas divided by "pi")
| |
| − | | |
| − | 2. Twiss parameters
| |
| − | | |
| − | 3. Ellipse centroid for longitudinal phase portrait
| |
| − | | |
| − | 4. sqrt(beta*emittance) and sqrt(gamma*emittance) - half sizes of the projections of the ellipses on the coordinate and divergence axes respectively.
| |
| − | | |
| − | Electrons - RMS
| |
| − | | |
| − | [[File:E1.png| 400 px]]
| |
| − | | |
| − | Electrons - 68.2% core
| |
| − | | |
| − | [[File:E2.png| 400 px]]
| |
| − | | |
| − | Positrons - RMS
| |
| − | | |
| − | [[File:P1.png| 400 px]]
| |
| − | | |
| − | Positrons - 68.2% core
| |
| − | | |
| − | [[File:P2.png| 400 px]]
| |
| − | | |
| − | | |
| − | | |
| − | | |
| − | | |
| − | The plot below shows the energy deposited in MeV along the pipe. The Z axis is along the beam direction. The distance around the beam pipe is determine by taking the pipe radius (34.8 mm) and multiplying it by the Phi angle around the pipe. The bins are 1cm x 1cm.
| |
| − | | |
| − | | |
| − | | |
| − |
| |
| − | {| border="1"
| |
| − | | [[File:BeamPipeDepEPhi_34.8_082815.png |200px]] ||[[File:BeamPipeDepE_34.8_082815.png| 200 px]]
| |
| − | |+ A maximum of 450,000 MeV is deposited in a 1 cm<math>^2</math> bin when 20 Million , 10 MeV electrons are incident on a 2 mm thick PbBi target located at Z=-902 mm.
| |
| − | |}
| |
| − | | |
| − | Below is energy deposited contributions from from photons(AVSzWg), positrons (AVSzWpos), and electrons.
| |
| − | | |
| − | | |
| − | [[File:BeamPipeDepE_34.8_082815_parttype.png | 200 px]]
| |
| − | | |
| − | Why is the positron hotspot upstream of the target? Because beam was going from right to left.
| |
| − | | |
| − | | |
| − | | |
| − | | |
| − | | |
| − | root commands used
| |
| − | | |
| − | TH2D *AVSz=new TH2D("AVSz","AVSz",100,-1000,0,12,-60,60)
| |
| − | BeamPipeE->Draw("35.*atan(PosYmm/PosXmm):PosZmm>>AVSz","DepEmeV");
| |
| − | AVSz->Draw("colz");
| |
| − | | |
| − | | |
| − | =Rate comparison with Energy and target thickness=
| |
| − | | |
| − | | |
| − | ;Difference with above simulation are that GEANT4 has SS windows and all created positrons that leave the target are counted , not just those going through a Sensitive detector downstream
| |
| | | | |
| − | == 6MeV==
| |
| − | {| border="1"
| |
| − | | PbBi Thickness (mm) || #positrons/million electrons (GEANT4.9.6.p02|| #positrons/million electrons (G4Beamline)
| |
| − | |-
| |
| − | | 0.5 || 284,306,281,290,288 = 290<math>\pm</math>10 ||
| |
| − | |-
| |
| − | | 1 || 465,449,457,454,472 = 459<math>\pm </math>9 ||
| |
| − | |-
| |
| − | | 1.5 ||456,416,445,445,434 =439<math>\pm </math>15 ||
| |
| − | |-
| |
| − | | 2 || 396,418,394,415,395 =404<math>\pm </math>12 ||
| |
| − | |-
| |
| − | | 3|| = <math>\pm</math> ||
| |
| − | |-
| |
| − | | 4||338,327,332,341,336=335<math>\pm </math>5||
| |
| − | |-
| |
| − | | 5|| =<math>\pm</math> ||
| |
| − | |-
| |
| − | | 7||257,280,265,268,259 =266<math> \pm </math>9 ||
| |
| − | |-
| |
| − | | 10||223,225,234,210,221 =223<math>\pm</math> 9 ||
| |
| − | |-
| |
| − | |}
| |
| | | | |
| − | == 8 MeV ==
| + | [[File:G4Bl-vs-MCNPX_5-5-2015.png| 500 px]] |
| − | {| border="1"
| |
| − | | PbBi Thickness (mm) || #positrons/million electrons (GEANT4.9.6.p02|| #positrons/million electrons (G4Beamline)
| |
| − | |-
| |
| − | | 0.5 || 458,458,535,533,516=500 <math>\pm </math>39 ||
| |
| − | |-
| |
| − | | 1 || 994,996,967,971,956=977<math> \pm </math>18 ||
| |
| − | |-
| |
| − | | 1.5 || 1166,1196,1139,1176,1178=1171<math>\pm</math> 21 ||
| |
| − | |-
| |
| − | | 2 || 1184,1212,1175,1194,1178=1189<math>\pm</math> 15 || | |
| − | |-
| |
| − | | 3|| = <math>\pm</math> ||
| |
| − | |-
| |
| − | | 4|| 989,1013,975,962,956= 979<math>\pm</math>23||
| |
| − | |-
| |
| − | | 5|| =<math>\pm</math> ||
| |
| − | |-
| |
| − | | 7|| 815,765,829,806,817=806<math> \pm</math> 25||
| |
| − | |-
| |
| − | | 10||641,660,636,671,682 = 658<math>\pm</math>20 ||
| |
| − | |-
| |
| − | |}
| |
| | | | |
| − | ==10 MeV ==
| |
| | | | |
| − | {| border="1"
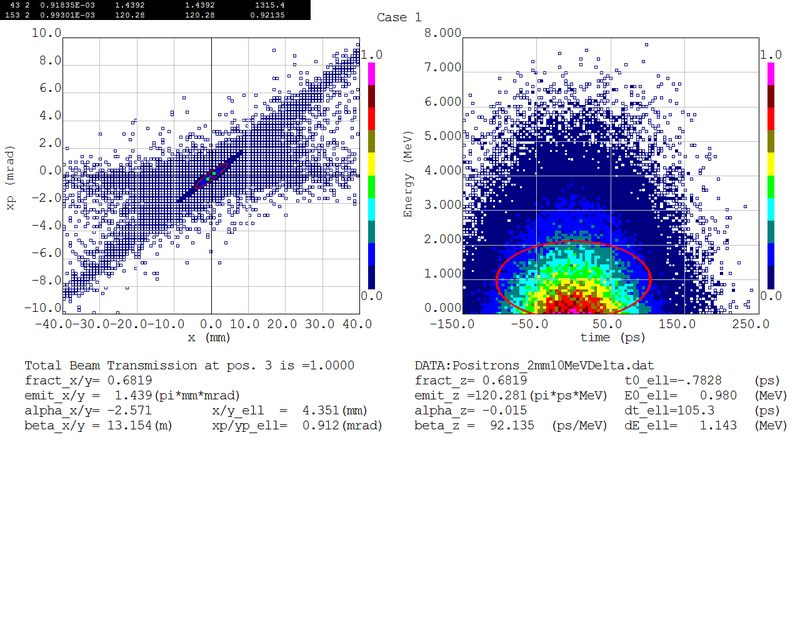
| + | Text files were delivered to Niowave so Niowave could begin designing a beamline to transport the positrons using a solenoid immediately downstream of the PbBi target. Dmitry, from Niowave, used the test files to calculate the beam transport properties of the positrons escaping the PbBi target. The phase space properties for the core positron distribution (68.2%) are shown below as well as their temporal distribution. |
| − | | PbBi Thickness (mm) || #positrons/million electrons (GEANT4.9.6.p02|| #positrons/million electrons (G4Beamline)
| |
| − | |-
| |
| − | | 0.5 || 628,653,713,686,689 = 674<math>\pm</math>33 ||
| |
| − | |-
| |
| − | | 1 || 1524,1607,1565,1598,1581 = 1575 <math>\pm</math> 33||
| |
| − | |-
| |
| − | | 1.5 || 2163,2264,2091,2154,2094= 2153<math>\pm</math> 70 ||
| |
| − | |-
| |
| − | | 2 ||2445,2386,2321,2359,2368 = 2376 <math>\pm</math> 45||
| |
| − | |-
| |
| − | | 3|| = <math>\pm</math> ||
| |
| − | |-
| |
| − | | 4||2087,2104,2121,2154,2118 = 2117 <math>\pm</math> 25||
| |
| − | |-
| |
| − | | 5|| =<math>\pm</math> ||
| |
| − | |-
| |
| − | | 7|| 1675,1697,1708,1720,1750=1710 <math> \pm</math> 28||
| |
| − | |-
| |
| − | | 10||1398,1421,1374,1418,1398 = 1402<math>\pm</math> 19||
| |
| − | |-
| |
| − | |}
| |
| | | | |
| | | | |
| − | [[File:PosProd-vs-E_2-9-16.png | 200 px]] | + | [[File:Pd2.png| 800 px]] |
