Difference between revisions of "CodyMilne G4Proj"
| Line 2: | Line 2: | ||
Here is the mass attenuation cross sections for Germanium --- [[File:massattenuation.gif | 200 px]] | Here is the mass attenuation cross sections for Germanium --- [[File:massattenuation.gif | 200 px]] | ||
| + | |||
| + | [[File:masaqerttenuation.gif | 200 px]] | ||
Here is the total photon attenuation for Germanium --- [[File:photoattenuationGe.png | 200 px]] | Here is the total photon attenuation for Germanium --- [[File:photoattenuationGe.png | 200 px]] | ||
Revision as of 00:03, 9 March 2016
Photon Energy deposition in a pure Ge crystal
Here is the mass attenuation cross sections for Germanium --- 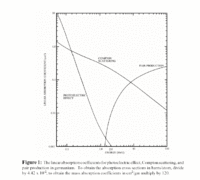
Here is the total photon attenuation for Germanium --- 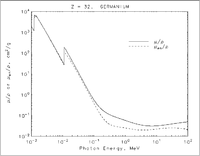
Here is the range of electrons in Ge as a function of energy --- 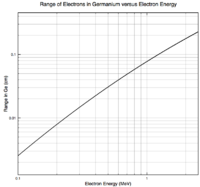
1)Determine total energy scoring in the Germanium block.
2) perform a fit to the 2nd hit distribution using an exponential fitting function. Do this for 100keV, 500keV, 1MeV, 3Mev and for this test, please run some 10 MeV gammas. —the result of the fit should be equal to the mass attenuation coefficient multiplied by the density of Ge. Therefore, dividing the fit result by 5.323 yields the mass attenuation coefficient at each energy and we can compare them directly with the NIST database values for validation of the GEANT4 total cross sections and sampling.
Using S2WN.Fit("expo");
I got for 3MeV constant: -1.88934 and slope: -1.84926e-02 +/- 1.63709e-02. Research shows this says these values are on a "log scale", not sure how exactly to read this.
1MeV: -2.852121 slope: -3.04127e-02 +/- 4.63910e-02
500k: -3.66350 slope: -4.25739e-02 +/- 1.10890e-01
3) for the same events (2nd hits), make a plot of the number of times that interaction was photoelectric, compton or pair production. Make the same 3-bin plot for each of the incident gamma energies. The relative rates of the first interactions evolve as a function of incident photon energy (see the plot of linear absorption coefficient on the wiki). —The ratios of event types can be compared with published values. I think these "spot checks" at those five energies are all we need to complete our initial validation of the GEANT4 sub-sampling.
| Date | Time |
| 1/26/16 | 1 hour |
| 1/27/16 | 1 hour |
| 1/29/16 | 1 hour |
| 2/4/16 | 1 hour |
| 2/5/16 | 3 hour |
| 2/8/16 | 2 hour |
| 2/9/16 | 2 hour |
| 2/10/16 | 1 hour |
| 2/11/16 | 2 hour |
| 2/14/16 | 2 hour |
| 2/16/16 | 2.5 hour |
| 3/02/16 | 1 hour |
| 3/06/16 | 1 hour |
Results of energy loss in Germanium
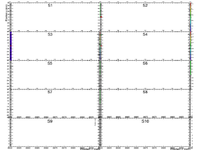
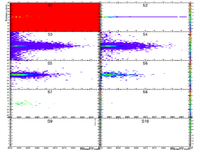
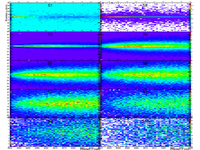
Why do SN>1 photons loose energy at Z = -9000?
10 eV
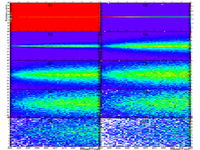
1-D plot of events for each step as function of Z
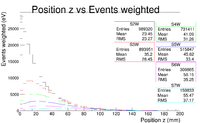
1-D plot of the energy deposited for each step as function of Z
100 eV
Start with = 100 eV
1 keV
Start with = 1 keV
10 keV
Start with = 10 keV
Energy Deposition
Send photons from inside an infinite crystal at 100, 500, 1000,3000 keV energy. Add up all the energy loss and see if you get delta functions or a delta + tail because GEANT4 stopped taking the photon and thus the energy is not accounted for.
100 keV
Start with = 100 keV
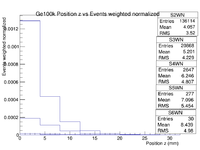
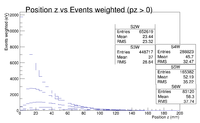
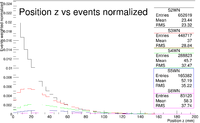
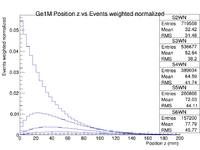
Initial verification - first hit position distribution is consistent with published attenuation coefficient.
500 keV
Start with = 500 keV
Change units on Y-axis to Energy (eV?)
"No Backscattering" Do another plot with momentum cut Pz>0
Add 9000 to Z-position to start Ge barrier at zero
Initial verification - The first gamma interaction distribution is consistent with the published Ge mass attenuation coefficient at 500keV (0.08212) and a Ge density of 5.323.
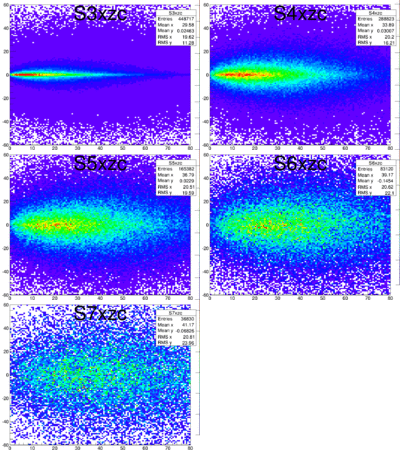
Are the 2-D plots energy weights (normalized)? Set the Z-axis color range by hand in cold.
1 MeV
Start with = 1 MeV
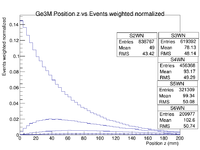
Initial verification - first interaction is consistent with published attenuation coefficient.
3 MeV
Start with = 3 MeV
Initial verification - first interaction distribution is consistent with published attenuation coefficient.
Runing Types
nohup ../exampleN02 run1.mac > /dev/null &
Divide canvas into 2 x 5
