Difference between revisions of "CodyMilne G4Proj"
(→1 MeV) |
(→3 MeV) |
||
| Line 124: | Line 124: | ||
[[File:CM_13MeVeLoss_2-8-2016.png | 200 px]] | [[File:CM_13MeVeLoss_2-8-2016.png | 200 px]] | ||
[[File:CM_3MeVPOSZvsEVENTSNORM_2-14-2016.png | 200 px]] | [[File:CM_3MeVPOSZvsEVENTSNORM_2-14-2016.png | 200 px]] | ||
| + | |||
| + | Initial verification - first interaction distribution is consistent with published attenuation coefficient. | ||
==Runing Types== | ==Runing Types== | ||
Revision as of 16:17, 19 February 2016
Photon Energy deposition in a pure Ge crystal
Here is the mass attenuation cross sections for Germanium --- 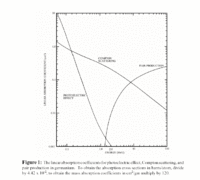
Here is the total photon attenuation for Germanium --- 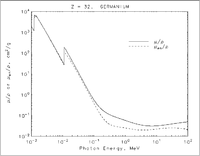
Here is the range of electrons in Ge as a function of energy --- 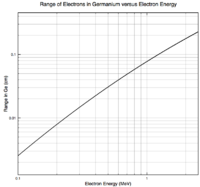
Determine the deposition of photons ranging in energy from 10 eV to 3 MeV in a pure Germanium crystal assuming an infinite block.
Attenuation coefficient about 1/5.323 cm = 0.19 cm or about 2 mm to maybe 2 cm?
Create file containing Photon Energy, ProcessID, step #, Energy Lost, Position for each step a photon takes through the Germanium crystal.
| Date | Time |
| 1/26/16 | 1 hour |
| 1/27/16 | 1 hour |
| 1/29/16 | 1 hour |
| 2/4/16 | 1 hour |
| 2/5/16 | 3 hour |
| 2/8/16 | 2 hour |
| 2/9/16 | 2 hour |
| 2/10/16 | 1 hour |
| 2/11/16 | 2 hour |
| 2/14/16 | 2 hour |
| 2/16/16 | 2.5 hour |
Results of energy loss in Germanium
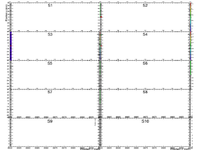
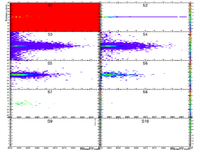
Why do SN>1 photons loose energy at Z = -9000?
10 eV
1-D plot of events for each step as function of Z
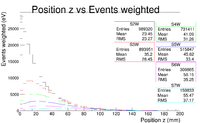
1-D plot of the energy deposited for each step as function of Z
100 eV
Start with = 100 eV
1 keV
Start with = 1 keV
10 keV
Start with = 10 keV
Energy Deposition
Send photons from inside an infinite crystal at 100, 500, 1000,3000 keV energy. Add up all the energy loss and see if you get delta functions or a delta + tail because GEANT4 stopped taking the photon and thus the energy is not accounted for.
100 keV
Start with = 100 keV
500 keV
Start with = 500 keV
Change units on Y-axis to Energy (eV?)
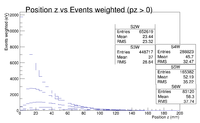
"No Backscattering" Do another plot with momentum cut Pz>0
Add 9000 to Z-position to start Ge barrier at zero
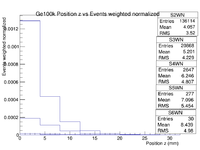
Initial verification - The first gamma interaction distribution is consistent with the published Ge mass attenuation coefficient at 500keV (0.08212) and a Ge density of 5.323.
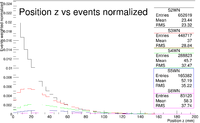
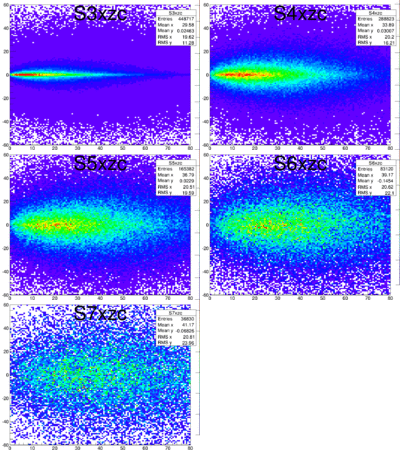
Are the 2-D plots energy weights (normalized)? Set the Z-axis color range by hand in cold.
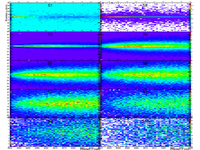
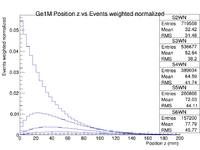
1 MeV
Start with = 1 MeV
Initial verification - first interaction is consistent with published attenuation coefficient.
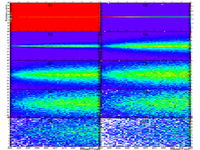
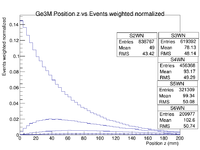
3 MeV
Start with = 3 MeV
Initial verification - first interaction distribution is consistent with published attenuation coefficient.
Runing Types
nohup ../exampleN02 run1.mac > /dev/null &
Divide canvas into 2 x 5
