Difference between revisions of "Neutron pinball"
| Line 11: | Line 11: | ||
==Effect of room air== | ==Effect of room air== | ||
| − | About 2% of neutrons were scattered in the air. Below is a histogram of neutron deflection angles, as seen by | + | About 2% of neutrons were scattered in the air. Below is a histogram of neutron deflection angles, as seen by a detector, when neutron-thorium interaction was turned off. Neutrons that didn't undergo any interaction are not included in this plot. |
[[File:AirDeflection.png|700 px|thumb|center|Non-zero deflection angles of neutrons by air]] | [[File:AirDeflection.png|700 px|thumb|center|Non-zero deflection angles of neutrons by air]] | ||
Revision as of 02:23, 30 January 2016
The Simulation
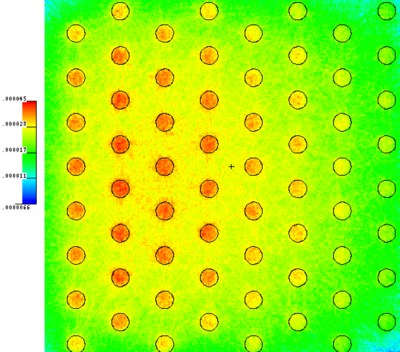
Photons with a Bremsstrahlung energy distribution are incident upon 64 thorium cylindrical targets. All thorium targets have 1 cm center-to-center spacing, a dia. of 0.4 cm, and a height of 8 cm. The target geometry is shown in the neutron flux plot below. The targets are surrounded by a cylindrical room filled with air, which has a radius equal to the distance between the target and the detectors (150 cm), and a height equal to the vertical extent of the detectors (76 cm). Upon the creation of a neutron from photofission, its initial direction of travel is logged. Once the neutron exits the cylindrical room, its direction of travel as seen by a detector placed room's edge, is compared to it's initial direction of travel, giving a neutron deflection angle.
Results
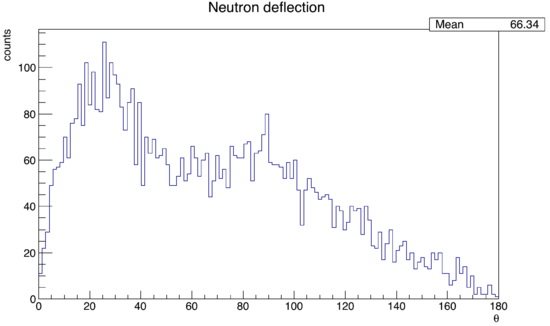
12% of neutrons scattered in the thorium cylinders alone, and 14% scattered when air was included. The histogram below reveals that if a neutron did scatter, it most likely did so at an unacceptable angle. Neutrons that didn't undergo any interaction are not included in this plot.
Effect of room air
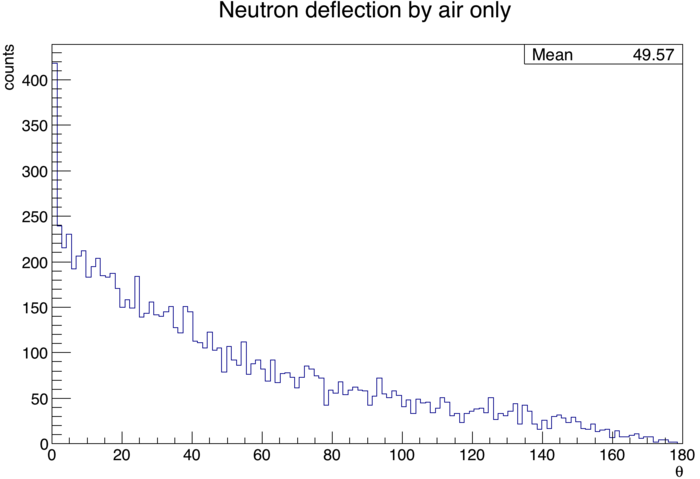
About 2% of neutrons were scattered in the air. Below is a histogram of neutron deflection angles, as seen by a detector, when neutron-thorium interaction was turned off. Neutrons that didn't undergo any interaction are not included in this plot.
Go back Elastic scattering


